Google’s new Index Coverage report lets you “Fix problems that prevent your URLs from being optimally indexed by Google Search.”
As it stands the report delivers a huge increase in visibility, creates a host of new metrics to track and requires new sitemap configurations. But the real treasures are what you learn when you dig into the data.
Index Coverage Report
The Index Coverage report is a Google Search Console public beta that provides details on the indexation status for pages on a site or in a specific sitemap or sitemap index. It’s essentially a mashup of Index status and Sitemaps on steroids.
You’ll know if you have access if you have a ‘Try the new Search Console’ link at the top of the left hand navigation in Search Console.
A handful of my clients are part of this public beta. I wish more were. I asked for additional client access but was turned down. So if you don’t have this link, I can’t help you gain access to the beta.
Instead, I hope to provide a decent overview of the functionality that may or may not wind up being launched. And later on I’ll show that the data this report contains points to important optimization strategies.
Clicking on that ‘Try’ link sends you to the new look Search Console.
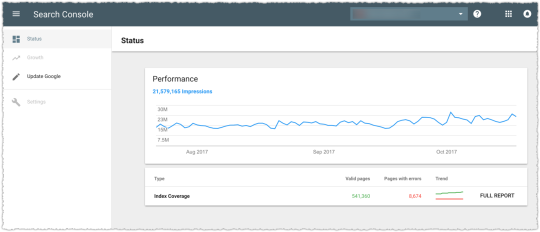
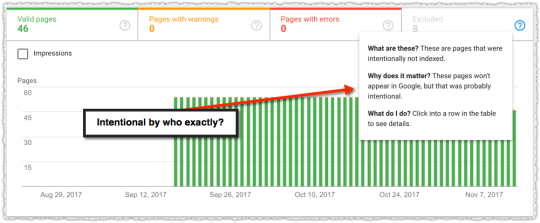
Clicking on the Index Coverage line gives you the full report. The top of the page provides a general trend in a stacked bar graph form for each status as defined by Google.
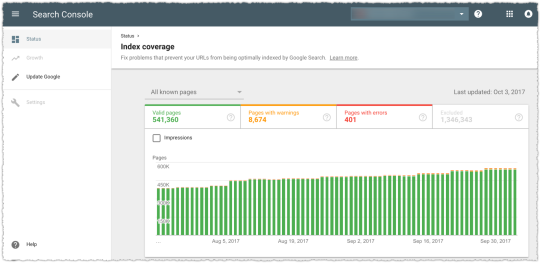
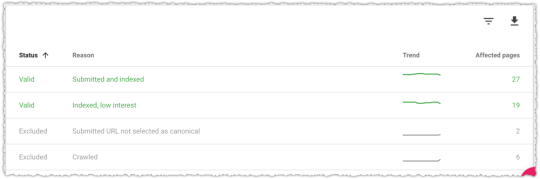
The bottom of the page gives you the details within each status.
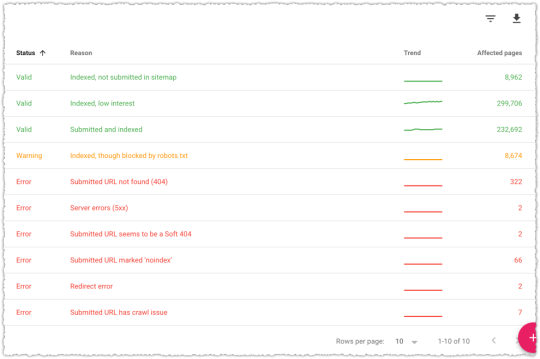
Clicking on any of those rows provides you with a sample list of 1000 pages.
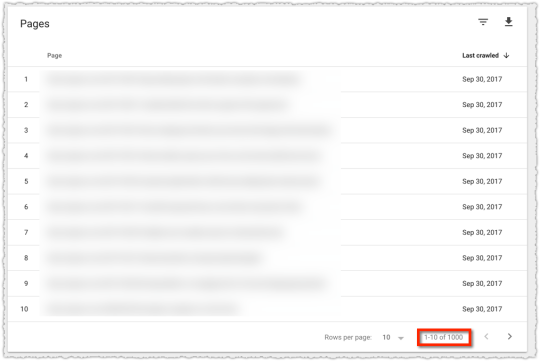
You can download this data, which I did as you’ll see later. You can also filter these pages by ‘Page’ or ‘Last crawled’ date.
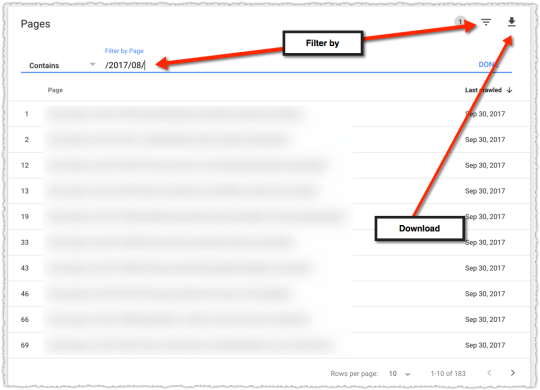
This is particularly handy if you have named folders or even patterned syntax (e.g. – condos-for-rent vs houses-for-rent) that you filter on and determine the ratio of content within the sample provided.
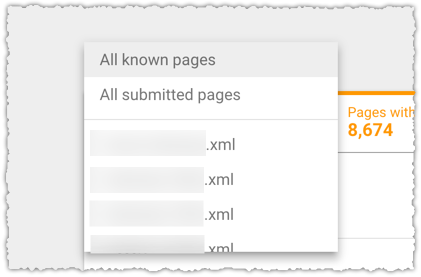
You can choose to see this data for all known pages, all submitted pages or for an individual sitemap or sitemap index that is at the top level in your Google Search Console account.
One thing to note here is that you must click the Excluded tab to add that to the report. And you’ll want to since there’s some interesting information in that status.
Indexation Status
The first thing to know here is that you get a lot of new terminology regarding the status of your URLs. Frankly, I think this is overkill for the vast majority of site owners. But I’m thrilled that the search community might get this level of detail.
Google classifies the status of a page into four major categories.
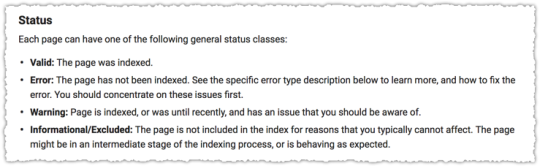
The Error and Warning areas are fairly straight forward so I’m not going to go into much detail there. Instead I want to cover the two major sub-status definitions for Valid pages.
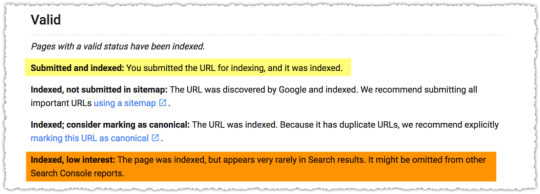
Indexed, Low interest. Well hello there! What is this? It felt very much like a low or thin content signal. Visions of Pandas danced in my head.
I spent a lot of time looking at the sample pages in the Indexed, Low interest status. Sometimes the sample pages for this status made sense and other times they didn’t. I couldn’t quite figure out what made something low interest.
One client looked at the traffic to these two cohorts using the sample data across a number of sitemaps. The results for a seven day period were stunning.
The pages in Submitted and Indexed delivered 4.64 visits per page.
The pages in Indexed, Low interest delivered 0.04 visits per page.

It’s pretty clear that you want to avoid the Indexed, Low interest status. I imagine Google holding their nose while indexing it and keeping it around just in case they need to resort to it for some ultra long-tail query.
In contrast, the Submitted and Indexed status is the VIP of index status and content. If your content falls into this status it will translate into search success.
The other status that drew my attention was Excluded.
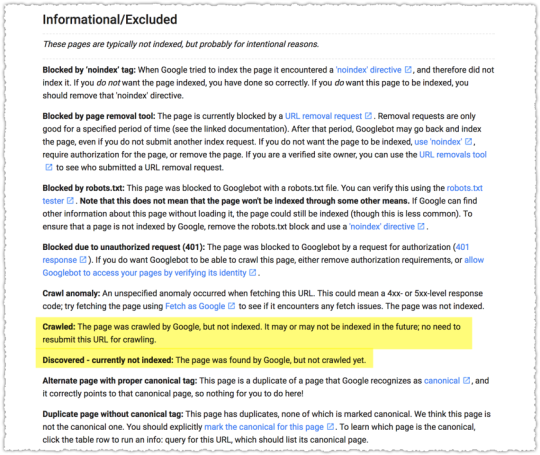
There are actually a lot more than pictured but the two most often returned are Crawled and Discovered – currently not indexed.
Reading the definitions of each it’s essentially Google giving the single bird and double bird to your content respectively. Crawled means they crawled it but didn’t index it with a small notation to ‘don’t call us, we’ll call you’.
Discovered – currently not indexed seems to indicate that they see it in your sitemap but based on how other content looks they’re not even going to bother crawling it. Essentially, “Ya ugly!” Or, maybe it’s just a representation of poor crawl efficiency.
Frankly, I’m not entirely sure that the definition of Discovered is accurate since many of the sample URLs under this status have a Last crawled date. That seems to contradict the definition provided.
And all of this is complicated by the latency in the data populating these reports. As of the writing of this post the data is 20 days behind. No matter the specific meaning, content with this status is bad news.
Indexation Metrics
New data leads to new calculated metrics. Sure you can track the trend of one status or another. But to me the real value is in using the data to paint a picture of health for each type of content.
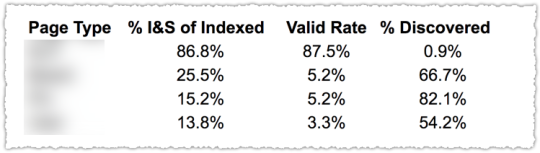
Here I have each page type as a separate sitemap index allowing me to compare them using these new metrics.
The ‘Valid Rate’ here is the percentage of pages that met that status. You can see the first has a massive Valid Rate while the others don’t. Not by a long shot.
But the metric I really like is the percentage Indexed and Submitted in relation to total Valid pages. In other words, of those pages that get the Valid status, how many of them are the ‘good’ kind.
Here again, the first page type not only gets indexed at a high rate but the pages that do get indexed are seen as valuable. But it’s the next two pages types that show why this type of analysis valuable.
Because both of the next two page types have the same Valid Rate. But one page type has a better chance of being seen as valuable than the next based on the percentage Indexed and Submitted.
I can then look at the percentage Discovered and see that there’s a large amount of pages that might be valid if they were crawled. With this in mind I’d work on getting the page type with a higher percentage I&S crawled more frequently since I have a 1 in 4 chance of those being ‘good’ pages.
Here’s an alternate way one client used to look at each sitemap and determine the overall value Google sees in each.
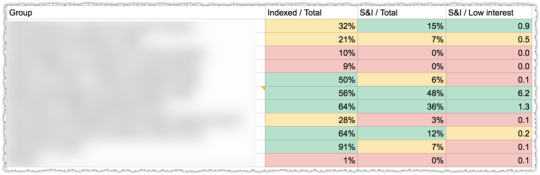
It’s the same general principle but they’re using a ratio of Submitted and Indexed to Low interest to determine general health for that content.
It remains to be seen exactly what metrics will make the most sense. But the general guidance here is to measure the rate at which content is indexed at all and once indexed what percentage is seen as valuable.
Sitemap Configuration
I’ve long been a proponent of optimizing your sitemaps to gain more insight into indexation by page type. That usually meant having a sitemap index with a number of sitemaps underneath all grouped by page type.
The current Index Coverage report will force changes to this configuration if you want to gain the same level of insight. Instead of one sitemap index with groups of sitemaps representing different page types you’ll need a separate sitemap index for each page type. For smaller sites you can have a separate sitemap at the top level for each page type.
This is necessary since there is no drill down capability from a sitemap index to individual sitemap within the tool. And even if there were, it would be difficult to aggregate all of this data across multiple sitemaps.
Instead, you’ll use the sitemap index to do all of the aggregation for you. So you’d have a sitemap index for each page type and might even make them more granular if you thought there was a material difference on the same page type (e.g. – rap lyrics versus rock lyrics).
Don’t worry, you can have multiple sitemap index files in your account (at least up to 500 I believe) so you’ll have plenty of room for whatever scheme you can cook up.
Defining Low Interest
I got very interested in determining why a page would wind up in the low interest bucket. At first glance I figured it might just be about content. Essentially a Panda signal for thin or low value content.
But the more I dug the more I realized it couldn’t just be a content signal. I kept seeing pages that were very similar showing up in both Indexed, Low Interest and Submitted and Indexed. But I needed a more controlled set of content to do my analysis.
And then I found it.
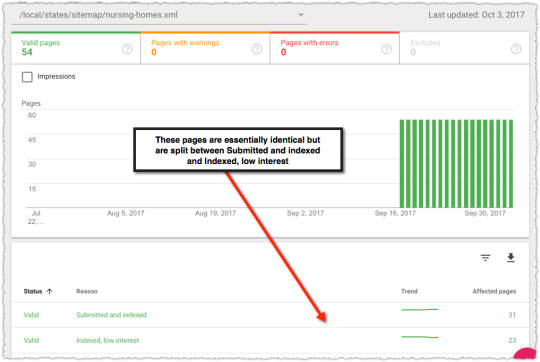
This sitemap contains state level pages for nursing homes. There are 54 in total because of Washington D.C., Guam, Puerto Rico and The Virgin Islands.
These pages are essentially navitorial pages meant to get users to the appropriate city of choice. What that means is that they are nearly identical.
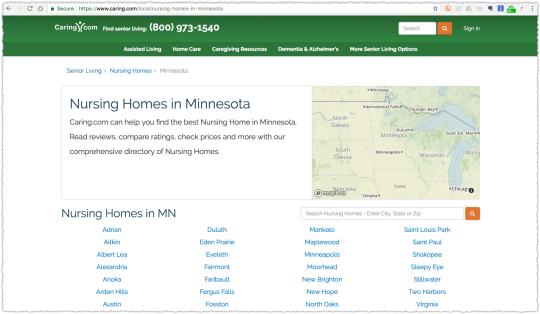
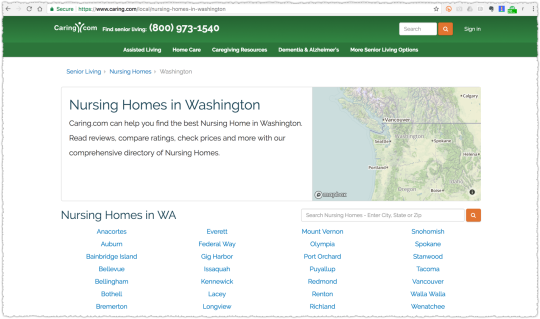
Which one do you think is the low interest page? Because one of them is and … one of them is not. Do you think you could figure that out simply from the text on the page?
This defined set of content allowed me to easily compare each cohort to see if there were any material differences. I downloaded the pages for each cohort and used a combination of Google Keyword Planner, ahrefs and SEMrush to compile metrics around query volume, backlinks and keyword difficulty.
The query class I used to calculate these metrics is ‘nursing homes in [state].
Query Metrics
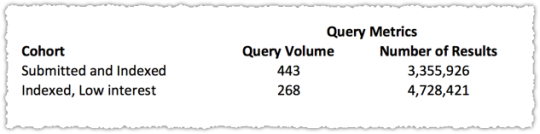
The volume is slightly higher for the Submitted and Indexed group but that’s skewed by Google grouping ‘va nursing homes’ into the Virginia query. This means folks potentially looking for veteran’s affairs nursing homes would fall into this query.
Low volume and high volume queries fall into both cohorts so I tend to think query volume isn’t a material difference. I added number of results to the mix after seeing the discrepancy between the two cohorts.
I found it a bit odd that there were fewer results for higher volume queries. I’m not sure what to make of this. Could there be a higher bar for content where there is a larger number of results? Further investigation is necessary but it didn’t jump to the top of my list.
Link Metrics
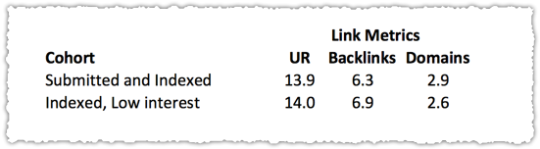
The link metrics from ahrefs show no material difference. Not only that but when I look at the links they’re all rather similar in nature. So I find it hard to believe that one set had better topical links or more trusted links than another from a Google perspective.
Keyword Difficulty Metrics
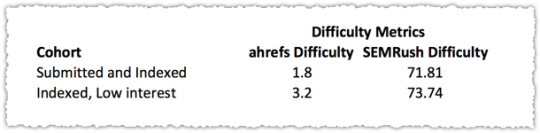
Here again there wasn’t a material difference. Even more so if I account for the fact that Texas spiked higher at the time because of the flooding of nursing homes due to hurricane Harvey.
Now, I wouldn’t be taking you down this road if I didn’t find something that was materially different. Because I did.
Crawl Metrics
I’ve long been a proponent of crawl efficiency and crawl optimization. So it was interesting to see a material difference in the reported last crawl for each cohort.
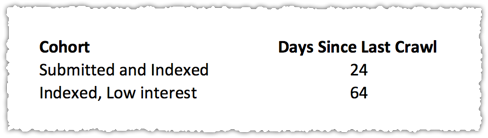
That’s a pretty stark difference. Could crawl date be a signal? Might the ranking team think so highly of the crawl team that pages that aren’t crawled as often are deemed less interesting? I’ve often thought something like this existed and have had offline talks with a number of folks who see similar patterns.
But that’s still just scuttlebutt really. So what did I do? I took one of the pages that was in the Low interest cohort and used Fetch as Google to request indexing of that page.
Sure enough when the data in the Index Coverage report was updated again that page moved from Low interest to Submitted and Indexed.
So, without any other changes Google was now reporting that a page that had previously been Low interest was now Submitted and Indexed (i.e. – super good page) based solely on getting it crawled again.

Now, the data for the Index Coverage report has been so woefully behind that I don’t yet know if I can repeat this movement. Nor do I know how long that page will remain in Submitted and Indexed. I surmise that after a certain amount of time it will return back to the Low interest cohort.
Time will tell.
[Updated on 10/24/17]
The Index Coverage report data updated through October 6th. The update revealed that my test to get another page moved from Indexed, Low interest to Submitted and Indexed through a Fetch as Google request was successful. The prior page I moved also remains in Submitted and Indexed.
Strangely, a third page moved from Indexed, Low interest to Submitted and Indexed without any intervention. It’s interesting to see that this particular state was an outlier in that Low interest cohort in terms of engagement.
[Updated on 11/9/17]
On October 20, the first page I fetched moved back from Submitted and Indexed to Indexed, Low Interest. That means it took approximately 22 days for the ‘crawl boost’ (for lack of a better term) to wear off.
On October 31, the second page I fetched moved back from Submitted and Indexed to Indexed, Low Interest. That means it took approximately 26 days for the ‘crawl boost’ to wear off.
It’s hard to get an exact timeframe because of how infrequently the data is updated. And each time they update it’s a span of days that all take on the same data point. If that span is 7 days I have no clear idea of when that page truly moved down.
From the data, along with some history with crawl analysis, it seems like the ‘crawl boost’ lasts approximately three weeks.
It should be noted that both URLs did not seem to achieve higher rankings nor drive more traffic during that ‘crawl boost’ period. My assumption is that other factors prevented these pages from fully benefitting from the ‘crawl boost’.
Further tests would need to be done with content that didn’t have such a long and potentially negative history. In addition, testing with a page where you’ve made material changes to the content would provide further insight into whether the ‘crawl boost’ can be used to rehabilitate pages.
[Updated on 11/20/17]
The data is now current through November 11th and a new wrinkle has emerged. There are now 8 URLs in the Excluded status.
One might think that they were all demoted from the Indexed, Low Interest section. That would make sense. But that’s not what happened.
Of the 6 URLs that are now in the Crawled status, three are from Indexed, Low Interest but three are from Submitted and Indexed. I’m not quite sure how you go from being super awesome to being kicked out of the index.
And that’s pretty much what Excluded means when you look at the information hover for that status.
The two other URLs that dropped now have the status Submitted URL not selected as canonical. Sure enough, it’s represented by one from Indexed, Low Interest and one from Submitted and Indexed.
There’s what I believe to be new functionality as I try to figure out what URL Google has selected as the canonical.
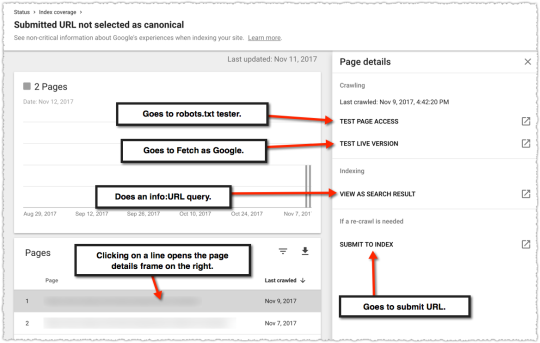
None of it actually helps me determine which URL Google thinks is better than the one submitted. It’s interesting that they’ve chosen to use the info: command given that the functionality of this operator was recently reduced.
And that’s when I realize that they’ve changed the URLs for these pages from /local/nursing-homes-in-[state] to /local/states/nursing-homes-in-[state]. They did this with a 301 (yay!) but didn’t update the XML sitemap (boo!).
This vignette is a prime example of what it means to be an SEO.
It also means using these pages as a stable set of data has pretty much come to an end. However, I’ll poke the client to update the XML sitemaps and see what happens just to see if I can replicate the original breakdown between Submitted and Indexed and Indexed, Low Interest.
Internal Links
How did Google decide not to crawl the low interest cohort group as frequently? Because while the crawl might be some sort of recursive signal there are only a few ways it could arrive at that decision in the first place.
We know the content is the same, the links are the same and the general query volume and keyword difficulty are the same. Internal links could come into play but there are breadcrumbs back to the state page on every city and property page.
So logically I’d hazard that a state like California would have far more cities and properties, which would mean that the number of internal links would be higher for that state than for others. The problem? California is in the Low interest cohort. So unless having more links is worse I don’t think this is material.
But, when in doubt you keep digging.
The internal links report doesn’t show all of the state pages but what it does show is certainly interesting. Of the 22 state pages that do show up on this report only 2 of them fall into the Low interest cohort.
So that means 20 of the original 30 Submitted and Indexed (66%) had reported internal link density while only 2 of the original 24 Low interest (8%) had reported internal link density. That’s certainly a material difference!
By comparison a Screaming Frog crawl shows that the real internal link difference between these pages is different in the way I expected with larger states having more links than smaller ones.
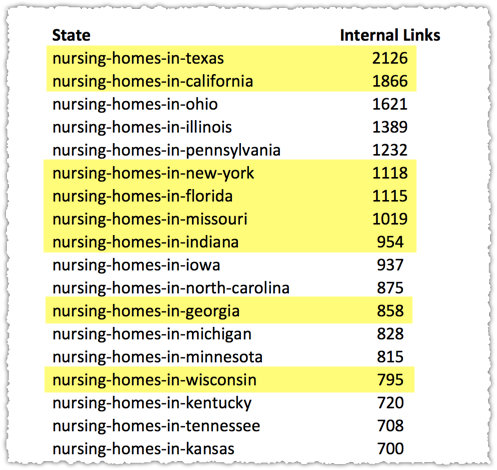
Those highlighted fall into the Low interest cohort. So there doesn’t seem to be a connection based on internal link density.
But let’s return to that Internal links report. It’s always been a frustrating, though valuable, report because you’re never quite sure what it’s counting and how often the data is updated. To date I only knew that making that report look right correlated highly with search success.
This new information gives rise to a couple of theories. Is the report based on the most recent crawl of links on a site? If so, the lower crawl rate for those in the Low interest cohort would produce the results seen.
Or could the links to those Low interest pages be deemed less valuable based on the evaluation of that page? We already know that Google can calculate the probability that a person will click on a link and potentially assign value based on that probability. So might the report be reflection of Google’s own value of the links they find?
Unfortunately there are few definitive answers though I tend to think the Internal links report oddity is likely driven by the crawl date discrepancy between the two cohorts.
Engagement Metrics
So I’m again left with the idea that Google has come to some conclusion about that cohort of pages that is then informing crawl and potentially internal link value.
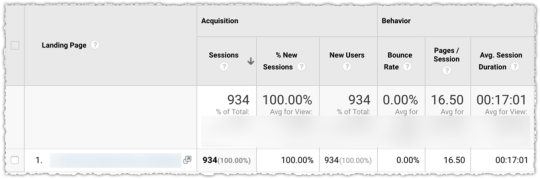
Some quick regex and I have Google Analytics data for each cohort back to 2009. Yeah, I’ve got 8 years of data on these suckers.
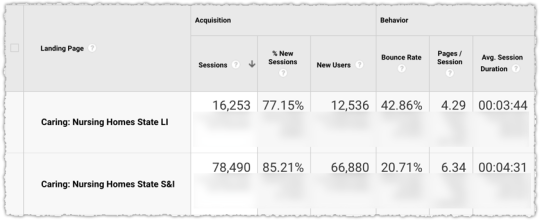
The engagement metrics on the Low interest cohort are materially worse than those on the Submitted and Indexed cohort.
Engagement, measured as some composite of adjusted click rate combined with a long click measurement, may be a factor in determining whether a page is of Low interest. It’s not the only factor but we’ve just ruled out a whole bunch of other factors.
“When you have eliminated the impossible, whatever remains, however improbable, must be the truth.”
Now, you might make the case that ranking lower might produce lower metrics. That’s possible but … I’m always wary when pretzel logic is introduced. Sure, sometimes our brain gets lazy and we make the easy (and wrong) connection but we also often work too hard to explain away the obvious.
Here’s what I do know. Pages in the Low interest cohort are clearly being demoted.
Query Based Demotion
The first Caring.com page returned for a search for ‘nursing homes in indiana’ is on page three and it isn’t the state page.
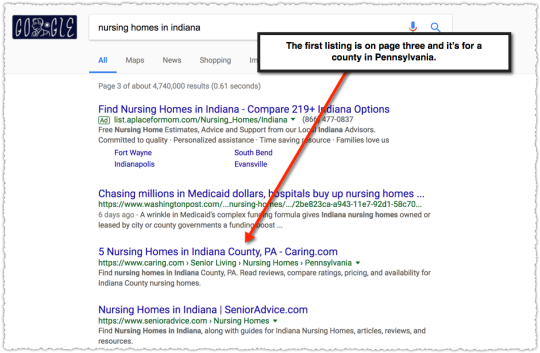
Google knows that this query is targeted toward the state of Indiana. There’s a local unit with Indiana listings and every other result on page one references the state of Indiana.
Now lets do the same search but with the site: operator.
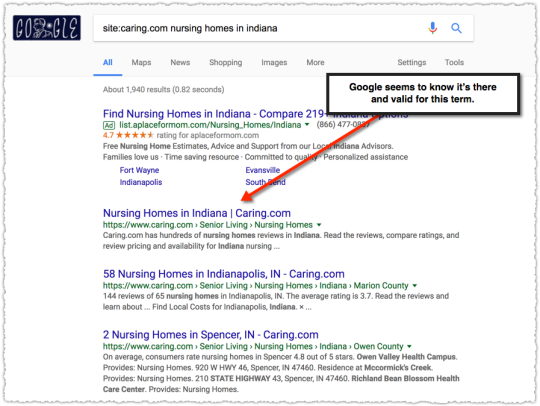
Suddenly Google has the state page as the first result. Of course the site: query isn’t a perfect tool to identify the most relevant content for a given query. But I tend to believe it provides a ballpark estimate.
If the site: operator removes other signals and simply returns the most relevant content on that site for a given term the difference between what is returned with and without is telling.
Any way you look at it, Google has gone out of their way to demote this page and others in the Low interest cohort for this query class. Yet for pages in the Submitted and Indexed cohort these state pages rank decently on page one (4th or 5th generally.)
Click Signals

The third rail of SEO these days is talking about click signals and their influence on rankings. I’ve written before about how the evidence seems to indicate Google does integrate this data into the algorithm.
There’s more I could add to that post and subsequent tests clients have done that I, unfortunately, can’t share. The analysis of these state pages provides further evidence that click data is employed. Even then, I acknowledge that it’s a small set of data and there could be other factors I’m missing.
But even if you don’t believe, behaving like you do will still help you succeed.
Other Index Coverage Findings
There are a number of other conclusions I’ve reached based on observing the data from multiple client reports.
Google will regularly choose a different canonical. Remember that rel=canonical is a suggestion and Google can and will decide to ignore it when they see fit. Stop canonical abuse and use 301 redirects (a directive) whenever possible.
Google sucks at dealing with parameters. I’ve said it over and over. Parameter’s are the devil. Googlebot will gorge themselves on parameter based URLs to the detriment of the rest of your corpus.
Google will ignore href lang targeted for that country or language. The markup itself is brittle and many have struggled with the issue of international mismatches. You can actively see them doing this by analyzing the Index Coverage report data.
One of the more frustrating situations is when the local version of your home page isn’t selected for that localized search. For instance, you might find that your .com home page is displayed instead of your .br home page in Brazil.
If you believe that engagement is a signal this actually might make sense. Because many home pages either give users and easy way to switch to a local domain or may automatically redirect users based on geo-IP or browser language. If this is the case, clicks on a mismatch domain would still provide positive engagement signals.
Those clicks would still be long clicks!
The feedback loop to Google would be telling them that the .com home page was doing just swell in Brazil. So there’s no reason for Google to trust your href lang markup and make the switch.
I’m not 100% convinced this is what is happening but … it’s a compelling argument.
Get Ready
There are a few things you can do to get ready for the full rollout of the Index Coverage report. The first is to reorganize your sitemap strategy so you have your sitemaps or sitemap index files all at the top level broken down by page type or whatever other strategy that delivers value.
The second is to begin or refine tracking of engagement metrics such as modified bounce rate and specific event actions that may indicate satisfaction. I’m still working to determine what baseline metrics make sense. Either way, SEO and UX should be working together and not against each other.
TL;DR
The new Index Coverage report provides a new level of insight into indexation issues. Changes to your sitemap strategy will be required to take full advantage of the new data and new metrics will be needed to better understand how your content is viewed by Google.
Data from the Index Coverage report confirms the high value of crawl efficiency and crawl optimization. Additional analysis also provides further evidence that click signals and engagement are important in the evaluation and ranking of content.
The Next Post: What I Learned in 2017
The Previous Post: Analyzing Position in Google Search Console

3 trackbacks/pingbacks
Comments About Google Index Coverage Report
// 13 comments so far.
Noah Learner // October 23rd 2017
Killer article. I love how you finally came to understand how engagement and click metrics were the ones driving Low Interest. New SEOs could learn so much about technical SEO analysis process from this.
I can’t wait to get the new GSC. It feels like it will really help me understand issues I’m facing with a couple of very thorny problems…
Killer.
AJ Kohn // October 23rd 2017
Thanks Noah. I appreciate the feedback on the analysis. I do think it’s important to do this type of work.
In fact, in doing the due diligence to support this piece I found the Internal links issue and that helped me connect the dots on crawl efficiency.
The new GSC certainly seems like it could be a huge boon for savvy SEOs. I’m just not sure how they’re going to marry the detailed reports with the vast majority of webmasters who don’t even understand the current version.
Jim Robinson // October 23rd 2017
Really interesting analysis, AJ. Question about sitemaps: If a helpful aggregation, such as page type or site section, is reflected in the URL structure, do you think the page filtering capability would lessen the need to have multiple sitemap indices/individual sitemaps?
AJ Kohn // October 23rd 2017
Thanks Jim.
Unfortunately not. For example, if you had 40,000 pages and the URL structure let you divide those pages up using filtering you could just use one sitemap but you’d get the status data for all 40,000 pages. And the filtering would only provide 1000 examples across those pages.
If 3,000 pages were Submitted and Indexed and 37,000 pages were Indexed, Low Interest you’d only have a 1,000 pages sample of all pages to determine which page type had the biggest issues. And you wouldn’t be able to calculate the true metrics for each page type.
So even if you have that filtering ability you’ll want to have separate sitemaps so you can see the different status metrics for each type of content and have a full 1,000 page sample of each for further analysis.
I’d say the URL pattern allows you to get even more granular with the 1,000 page sample. But you want as many of those samples as you can get.
Yusuf Bitrus // October 23rd 2017
I really can’t wait to set my website up on the new GSC, The analytics provided above in here are killer tips, it will make easy for beginners and intermediates to use.
Priyo Mukherjee // October 25th 2017
Another Master Article from AJ! Great research and explanation.
Eager to see the New Google Search Console. Lots of cool stuff and some worried. Nice to see they are going to provide a way to see pages which are in the sandbox after years.
Quinton // November 02nd 2017
My ADD struggles with long articles that has a lot of data.
Worth.Every.Second.
Impressed that you kept looking for strong correlations. Repeatedly. Impressive tenacity.
Mohammad Lafi // November 08th 2017
The last time I followed a blog this closely was years ago, you Sir, provide value in a single blog post that I can’t find in entire publications. Thank you!
Leah // November 09th 2017
This is a fantastic post. Thank you for taking us through your detective work!
Adam Davies // November 14th 2017
A great article, AJ. I often have to remind people that canonical tags are suggestions and not directives. I think Google relies on them far less now than it once use to… Probably due to abuse, but it’s a shame nonetheless!
Chase Billow // November 20th 2017
Yeah, great post AJ. I cringe at the thought of how long something like this would take me to write up, so you get a big “thank you” from me for taking the time to put this together and share for all of us.
AJ Kohn // November 21st 2017
Thanks Chase. I appreciate the feedback and hope it helps folks when the report is released to everyone.
LION EATER // January 06th 2018
As a technical SEO, really appreciated the depth of this. Internal linking can make a huge difference for ranking. It’s the first place to look when pages are performing poorly in local search. Great post!
Sorry, comments for this entry are closed at this time.
You can follow any responses to this entry via its RSS comments feed.