This blog is in a sad state. It was hacked and the recovery process wasn’t perfect.
I should fix it and I should blog more! But my consulting business is booming. And almost all new business comes via referrals. There’s only so much time – that precious finite resource! So I shrug my digital shoulders and think, it’s good enough.
Good enough might cut it for some random blog. But not for a search engine. Yet, that’s what I see happening in slow-motion over the past few years. Google search has become good enough or as I’ve come to think of it – goog enough.

Photo Credit: John Margolies
So how did we get here? Well, it’s long and complicated. So grab the beverage of your choice and get comfortable.
(Based on reader feedback you can now navigate to the section of your choice with the following jump links. I don’t love having this here because it sort of disrupts the flow of the piece. But I acknowledge that it’s quite long and that some may want to return to the piece mid-read or cite a specific section.)
Brand Algorithm
Implicit User Feedback
Experts On Everything
Unintended Consequences
Weaponized SEO
The Dark Forest
Mix Shift
Information Asymmetry
Incentive Misalignment
Enshittification
Ad Creep
Context Switching and Cognitive Strain
Clutter
Google Org Structure
ChatGPT
Groundhog Day
Editorial Responsibility
Food Court Search Results
From Goog Enough to Great
Brand Algorithm
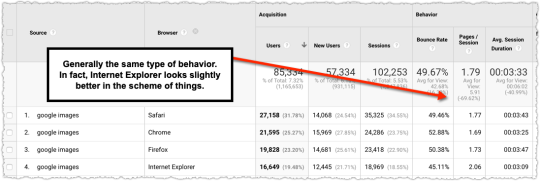
One of the common complaints is that Google is biased toward brands. And they are, but only because people are biased toward brands.
My background, long ago, is in advertising. So I’m familiar with the concept and power of aided awareness, which essentially measures how well you recognize a brand when you’re prompted (i.e. – aided) with that brand.
Every Google search is essentially an aided awareness test of sorts. When you perform a Google search you are prompted with multiple brands through those search results. The ones that are most familiar often get an outsized portion of the clicks. And as a result those sites will rank better over time.
If you’re not in the SEO industry you may not realize that I just touched a third rail of SEO debate. Does Google use click data in their algorithms? The short answer is yes. The long answer is complex, nuanced and nerdy.
Implicit User Feedback
(Feel free to skip to the Experts On Everything section if technical details make you sleepy.)
I actually wrote about this topic over 8 years ago in a piece titled Is Click Through Rate a Ranking Signal?
I botched the title since it’s more than just click through rate but click data overall. But I’m proud of that piece and think it still holds up well today.
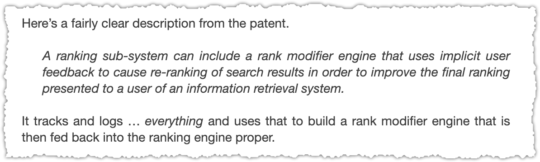
One of the more critical parts of that piece was looking at some of Google’s foundational patents. They are littered with references to ‘implicit user feedback’. This is a fancy way of saying, user click data from search engine results. The summation of that section is worth repeating.
Since I wrote that other things have come to light. The first comes from Google documents leaked by Project Veritas in August of 2019. For the record, I have zero respect for Project Veritas and their goals. But one of the documents leaked was the resume of Paul Haahr.
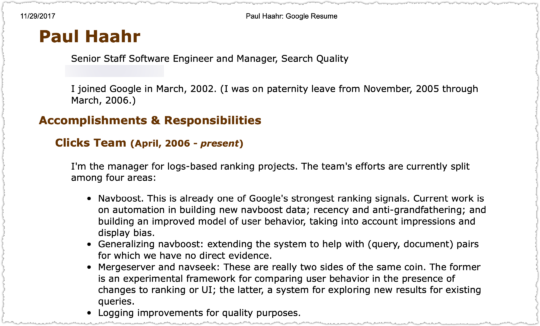
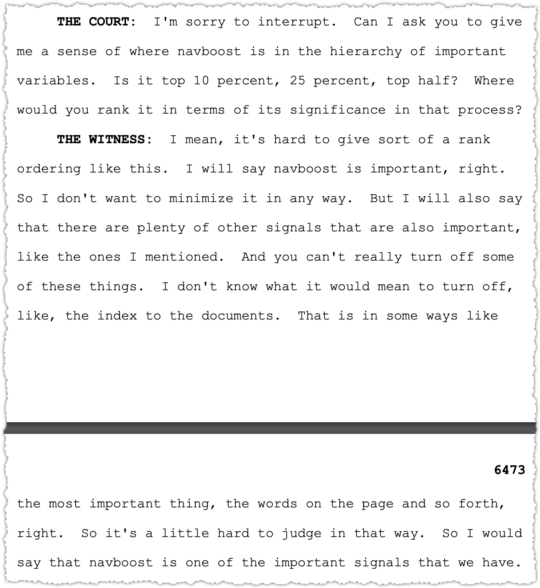
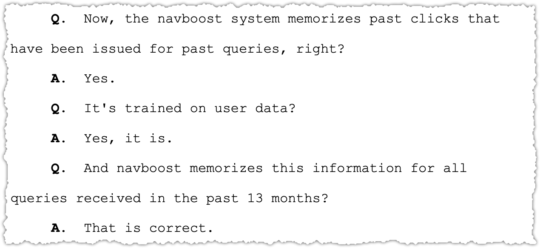
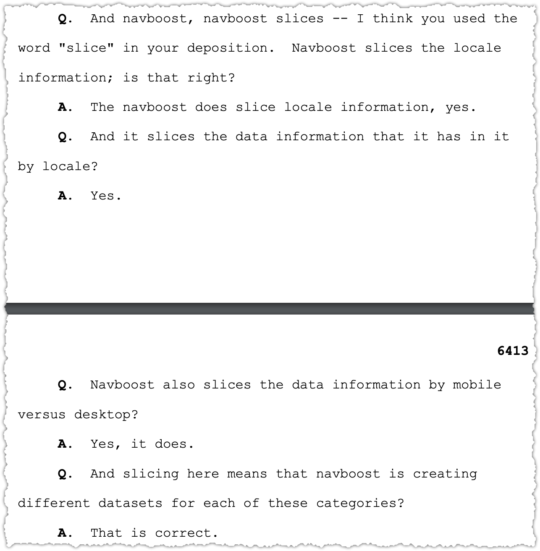
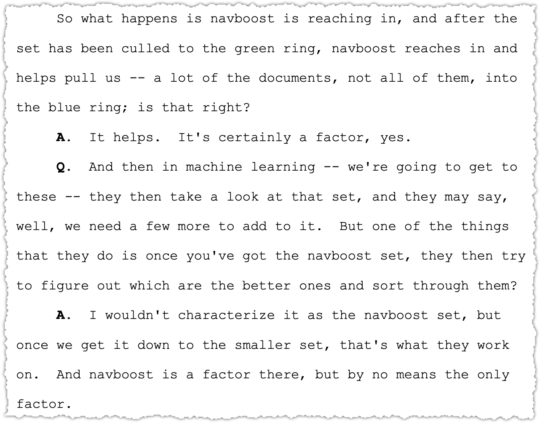
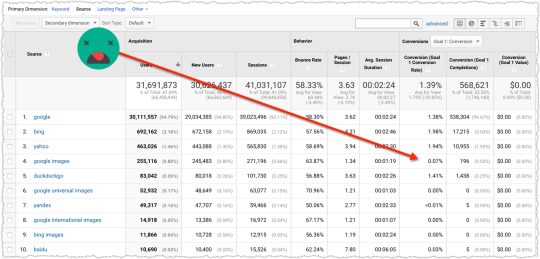
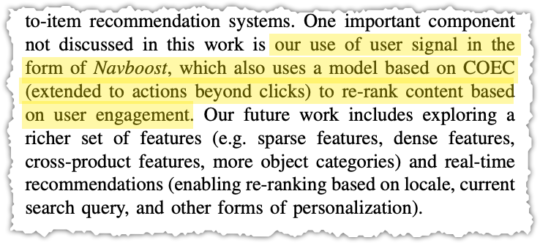
The fact that there was a Clicks team seems rather straight-forward and you’d need some pretzel logic to rationalize that it wasn’t about using click data from search results. But it might be easier to make the case using Navboost by looking at how it’s used elsewhere.
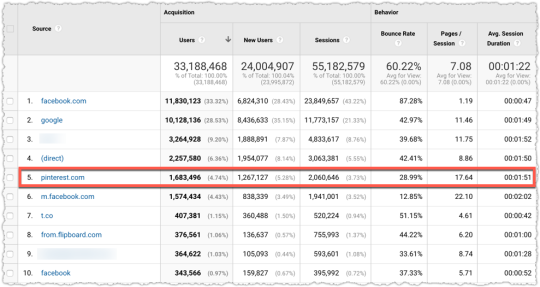
In this instance, it’s Pinterest, with the papers Demystifying Core Ranking in Pinterest Image Search (pdf) and Human Curation and Convnets: Powering Item-to-Item Recommendations on Pinterest (pdf).
Here are the relevant sections of both pertaining to Navboost.
The COEC model is well-documented with this calculation excerpt from a Yahoo! paper (pdf).
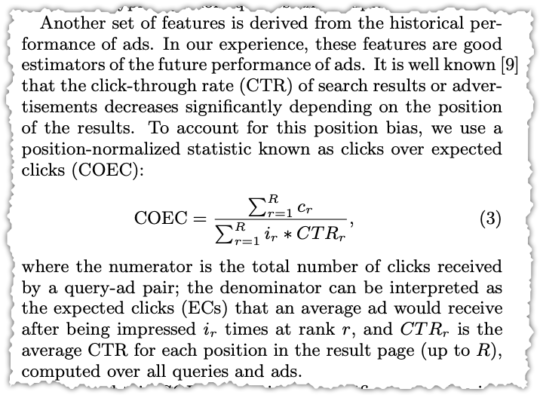
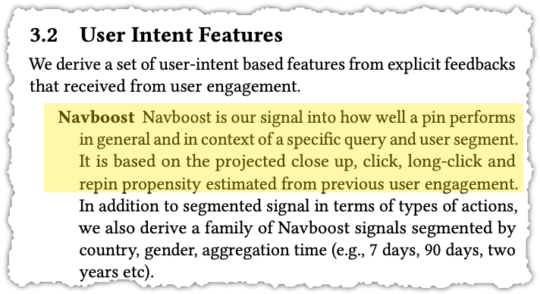
The calculation looks daunting but the general idea behind Navboost is to provide a boost to documents that generate higher clicks over expected clicks (COEC). So if you were ranked fourth for a term and the expected click rate was x and you were getting x + 15% you might wind up getting a ranking boost.
The final pieces, which puts an end to the debate, come from antitrust trial exhibits that include a number of internal Google presentations.
The first is Google presentation: Life of a Click (user-interaction) (May 15, 2017) (pdf) by former Googler Eric Lehman.
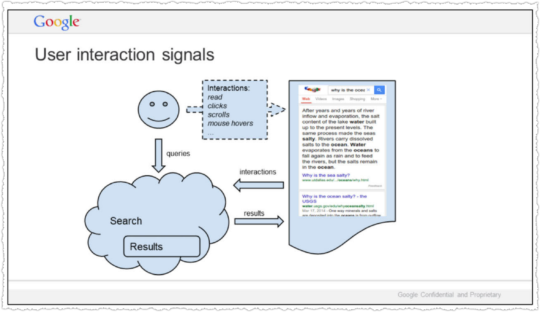
What’s crazy is that we don’t actually understand documents. Beyond some basic stuff, we hardly look at documents. We look at people. If a document gets a positive reaction, we figure it is good. If the reaction is negative, it is probably bad. Grossly simplified, this is the source of Google’s magic.
Yes, Google tracks all user interactions to better understand human value judgements on documents.
Another exhibit, Google presentation: Google is magical. (October 30, 2017) (pdf) is more concise.
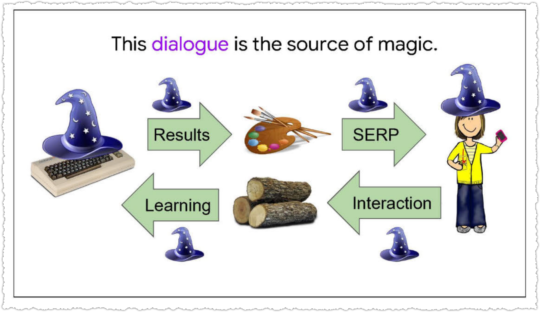
The source of Google’s magic is this two-way dialogue with users.
Google presentation: Q4 Search All Hands (Dec. 8, 2016) goes into more depth.
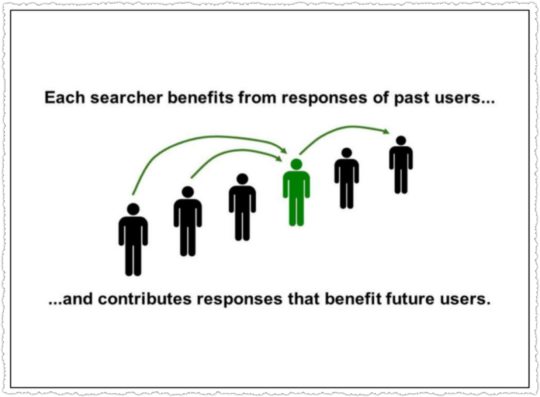
SO… if you search right now, you’ll benefit from the billions of past user interactions we’ve recorded. And your responses will benefit people who come after you. Search keeps working by induction.
This has an important implication. In designing user experiences, SERVING the user is NOT ENOUGH. We have to design interactions that also allow us to LEARN from users.
Because that is how we serve the next person, keep the induction rolling, and sustain the illusion that we understand.
The aggregate evaluations of prior user interactions help current search users who pass along their aggregate user interactions to future search users.
Perhaps the most important exhibit in this context is Google presentation: Logging & Ranking (May 8, 2020) (pdf)
Within that deck we get the following passages.
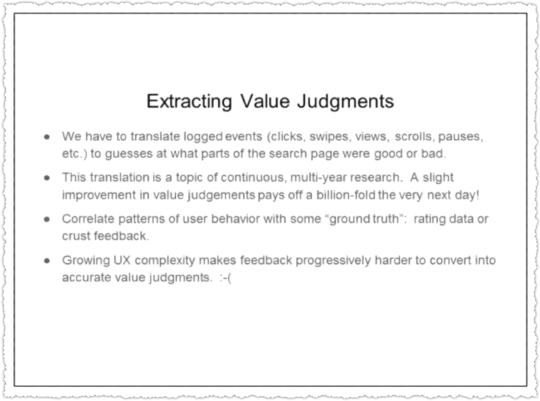
The logs do not contain explicit value judgments– this was a good search results, this was a bad one. So we have to some how translate the user behaviors that are logged into value judgments.
And the translation is really tricky, a problem that people have worked on pretty steadily for more than 15 years. People work on it because value judgements are the foundation of Google search.
If we can squeeze a fraction of a bit more meaning out of a session, then we get like a billion times that the very next day.
The basic game is that you start with a small amount of ‘ground truth’ data that says this thing on the search page is good, this is bad, this is better than that. Then you look at all the associated user behaviors, and say, “Ah, this is what a user does with a good thing! This is what a user does with a bad thing! This is how a user shows preference!’
Of course, people are different and erratic. So all we get is statistical correlations, nothing really reliable.
I find this section compelling because making value judgments on user behavior is hard. I am reminded of Good Abandonment in Mobile and PC Internet Search one of my favorite Google papers by Scott Huffman, that determined that some types of search abandonment were good and not bad.
Finally, we find that these user logs are still the fuel for many modern ranking signals.
As I mentioned, not one system, but a great many within ranking are built on logs.
This isn’t just traditional systems, like the one I showed you earlier, but also the most cutting-edge machine learning systems, many of which we’ve announced externally– RankBrain, RankEmbed, and DeepRank.
RankBrain in particular is a powerful signal, often cited as the third most impactful signal in search rankings.
Boosting results based on user feedback and preference seems natural to me. But this assumes that all sides of the ecosystem – platform, sites and users – are aligned.
Increasingly, they are not.
Experts on Everything
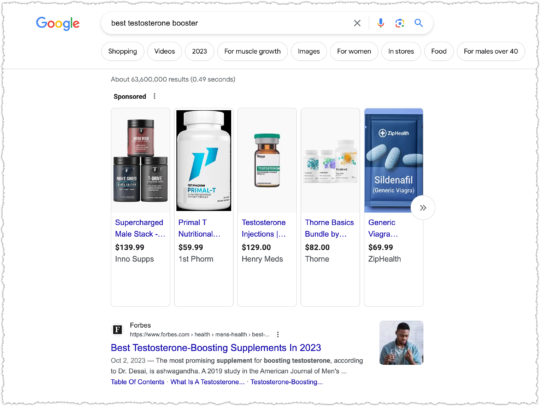
Whether you believe my explanation for why brands are ranking so well, it’s happening. In fact, a growing number of brands realize they can rank for nearly anything, even if it is outside of their traditional subject expertise.
I don’t exactly blame these brands for taking this approach. They’re optimizing based on the current search ecosystem. It’s not what I recommend to clients but I can understand why they’re doing it. In other words, don’t hate the player, hate the game.
With that out of the way, I’ll pick on Forbes.
Published eight times a year, Forbes features articles on finance, industry, investing, and marketing topics. It also reports on related subjects such as technology, communications, science, politics, and law.
Funny, I don’t see health in that description. But that doesn’t stop Forbes from cranking out supplement content.
Need some pep for your sex drive? Forbes is goog enough!
Need a good rest? Forbes is goog enough!
Got a pet that sheds? Forbes is goog enough.
Or maybe you’re looking for a free VPN? Forbes? Goog enough!
Now this is, at least, technology adjacent, which is in their related topics description in Wikipedia. But does anyone really think Forbes has the best advice on free VPN?
Forbes still works under a contributor model, which means you’re never quite sure as to the expertise of the writer and why that content is being produced other than ego and getting ad clicks. (I mean, you have to be a click ninja to dodge the ads and read anything on the site anyway.)
It’s not just me that thinks this model produces marginal content. An incomplete history of Forbes.com as a platform for scams, grift, and bad journalism by Joshua Benton says it far far better than I could.
And unlike a bunch of those folks on Forbes, Joshua has the writing chops.
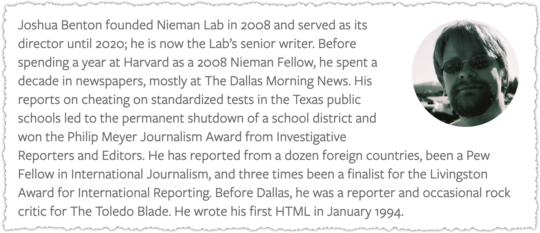
Perhaps the most notable gaffe was having Heather R. Morgan (aka – Razzlekhan) write about cybersecurity when she was guilty of attempting to launder $4.5 billion of stolen bitcoin.
But regular people still have a positive brand association with Forbes. They don’t know about the contributor model or the number of times it’s been abused.
So they click on it. A lot. Google notices these clicks and boosts it in rankings and then more people click on it. A lot.
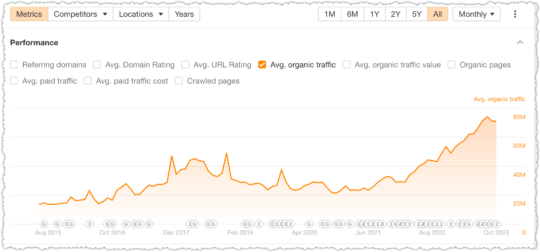
The result is, according to ahrefs, a little over 70MM in organic traffic each month.
Forbes isn’t the only one doing this, though they might be the most successful.
When you’re looking for the best body scrub you naturally think of … CNN?
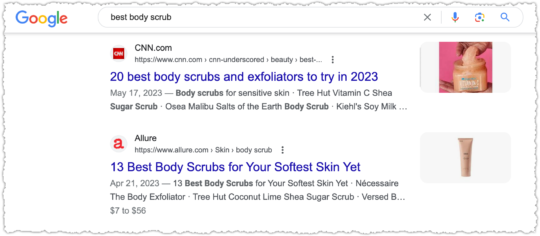
Goog enough!
Or maybe you’ve caught this round of COVID and you need a thermometer.
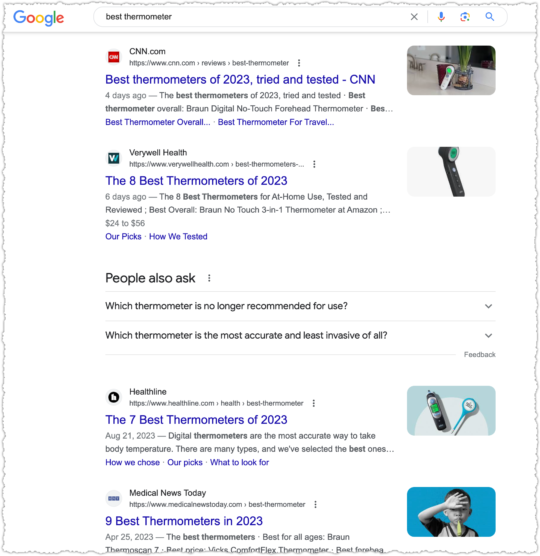
Silly health sites. CNN is goog enough!
All of this runs through the /cnn-underscored/ folder on CNN, which is essentially a microsite designed to rank for and monetize search traffic via affiliate links. It seems modeled after The New York Times and its Wirecutter content.
There are plenty of others I can pick on including Time and MarketWatch. But I’ll only pick on one more: U.S. News & World Report.
Looking for the best HVAC system?
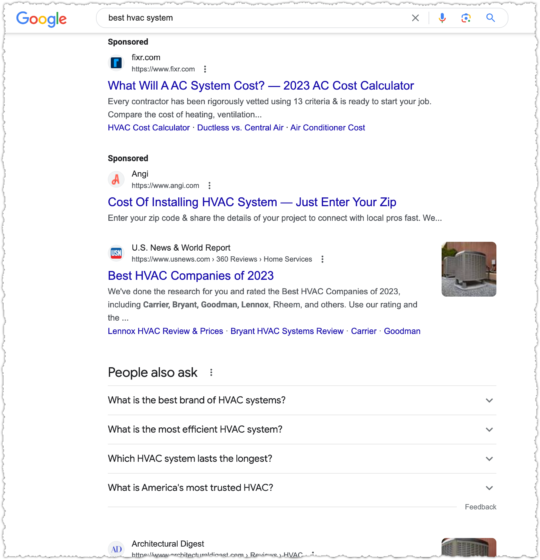
U.S. News is goog enough!
When it comes to cooking though, some sort of recipe or food site has to be ranking right?
Naw, U.S. News is goog enough!
U.S. News takes it a step further when they get serious about a vertical. They launch subdomains with, by and large, content from third-parties. Or as they are prone to doing, taking third-party data and weighting it to create rankings.
You might have heard about some of the issues surrounding their College Rankings. Suffice to say, I find it hard to believe U.S. News is the very best result across multiple verticals, which includes, cars, money, health, real estate and travel.
At this point you know the refrain. In most cases, it’s goog enough!
At least in this last one The National Council on Aging is ahead of U.S. News. But they aren’t always and I fail to see why it should be this close.
Unintended Consequences
The over reliance on brand also creates sub-optimal results outside of those hustling for ad and affiliate clicks.
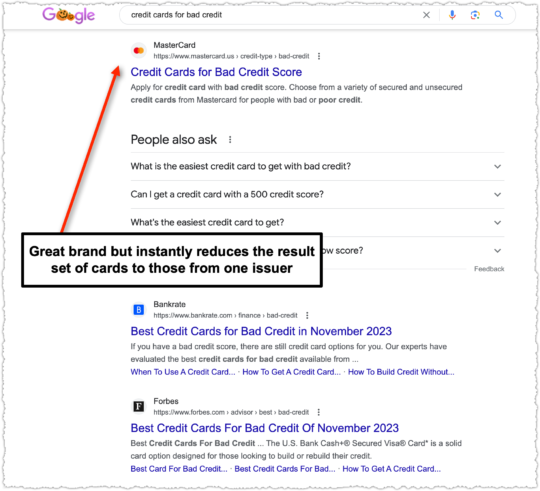
Here MasterCard is ranking for a non-branded credit card query. MasterCard is clearly a reputable and trusted brand within this space. But this is automatically a sub-optimal result for users because it excludes cards from other issuers like Visa and Discover.
It gets worse if you know a bit about this vertical. When you click through to that MasterCard page you’re not provided any information to make an informed decision.

Why isn’t MasterCard showing the rates and fees for these cards?
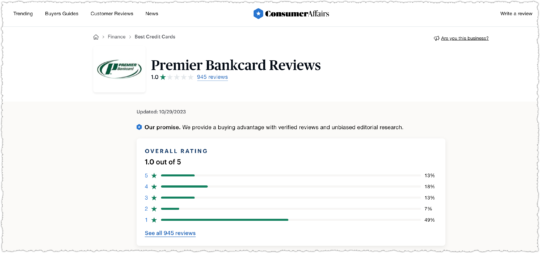
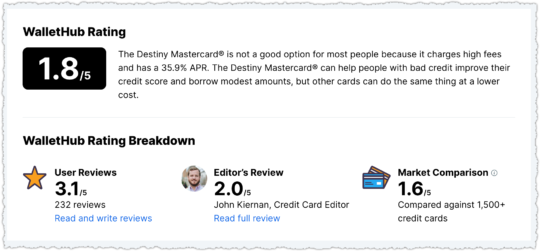
In short, those cards are pretty dreadful for consumers, particularly consumers who are in a vulnerable financial position. And the rate and fee information is available as you can see in the WalletHub example. There are better options available but users may blindly trust the MasterCard result due to brand affinity.
A lot of the terms I’ve chosen revolve around the ‘best’ modifier, which is in many ways a proxy for review intent. And reviews are a bit of a bugaboo for Google over the last few years. They even created a reviews system to address the problem. Yet, we still get results for review queries where the site or product itself is ranking.
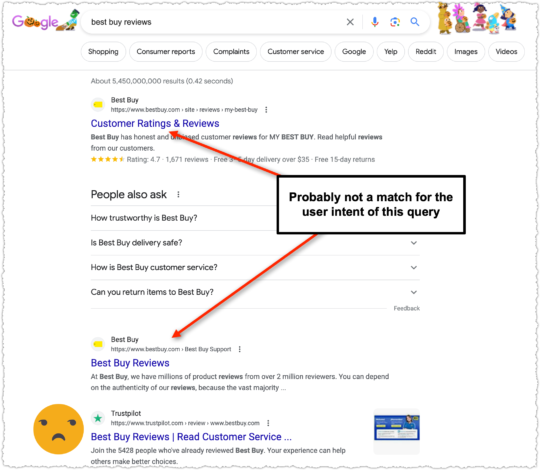
If I’m looking for reviews about a site or product I’m not inclined to believe the reviews from that site. It’s like getting an alibi from your spouse.
The thing is, I get why Best Buy is trying so hard to rank well for this term. Because right below them is TrustPilot.
Weaponized SEO
What’s the problem with TrustPilot? Well, let me tell you. The way their business model works is by ranking for a ‘[company/site] reviews’ term with a bunch of bad reviews and a low rating.
Once TrustPilot ranks well (usually first) for that term, it does some outreach to the company. The pitch? They can help turn that bad rating into a good one for a monthly fee.
If you pay, good reviews roll in and that low rating turns around in a jiffy. Now when users search for reviews of your company they’ll know you’re just aces!
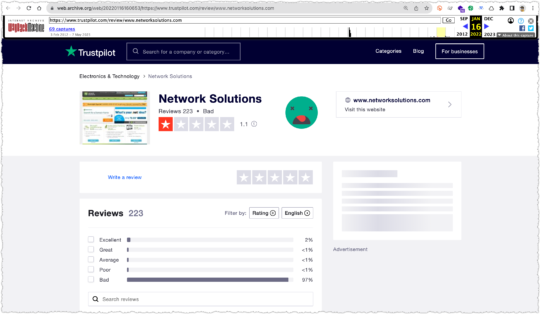
One of the better examples of this is Network Solutions, a company that a friend of mine has written about in great detail. Using the Internet Archive you can see that Network Solutions had terrible ratings on TrustPilot as of January 2022 when they were not a customer.
By December 2022 Network Solutions had become a customer (i.e. – verified company) and secured a rating of 4.3.
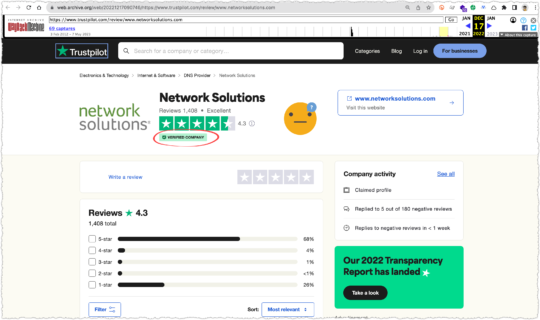
Some of you might be keen enough to look at the distribution of ratings and wonder how Network Solutions can have a 4.3 rating with 26% of the total being 1.0.
A simple weighting of the ratings would return a 3.87.
(5*.68)+(4*.04)+(3*.01)+(2*.01)+(1*.26) = 3.87
But if you hover over that little (i) next to the rating you find out they don’t use a simple average.
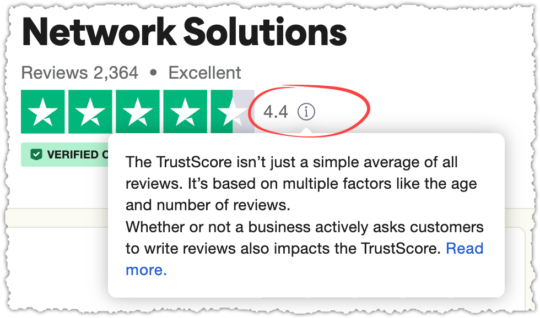
Following that link you can read how TrustScore is calculated. I have to say, I’m grudgingly impressed in an evil genius type of way.
-
Time span. A TrustScore gives more weight to newer reviews, and less to older ones. The most recent review holds the most weight, since newer reviews give more insight into current customer satisfaction.
-
Frequency. Businesses should continuously collect reviews to maintain their TrustScore. Because the most recent review holds the most weight, a TrustScore will be more stable if reviews are coming in regularly.
So all the bad reviews and ratings they collected to rank and strong arm businesses can be quickly swept away based on review recency. And all you have to do to keep your ratings high is to keep using their product. Slow clap.
I would bet customers have no idea this is how ratings are calculated. Nor do they understand, or likely care, about how TrustPilot uses search to create a problem their product solves. But TrustPilot looks … trustworthy. Heck, trust is in their name!
Now a company is likely neither as bad before nor as good after they become a TrustPilot customer. There is ballot box stuffing on both sides of the equation. But it’s unsettling that reddit is awash in complaints about TrustPilot.
Ugly truth behind TrustPilot Reviews contains the following comment:
I tried to leave a bad review on Trustpilot once, but the business was given an opportunity to protest before my review was published. TP demanded proof of my complaint. I provided an email chain but the business kept arguing nonsense and TP defaults to taking their side. The review was never posted. I’ve assumed since then that the site is completely useless because businesses seem to be able to complain until reviews get scrubbed.
Finding out that Trustpilot is absolutely NOT trustworthy! contains the following comment:
I complained about an insurance company who failed to look for the other party in an accident, failed to sort out the courtesy car, and didn’t call us or write to us when they said they would in a review. The company complained and TrustPilot took it down. I complained and TrustPilot asked me to provide evidence of these things that didn’t happen. I asked them what evidence of nonexistent events would satisfy them and they said it was up to me to work that out.
Fake Trustpilot review damaging my business contains the following comment:
I would just add, Trustpilot is a tax on businesses. It ruined my business because, usually, only unhappy people leave a review unsolicited. However, if you pay Trustpilot, they’ll send review requests to every customer and even sort you out with their special CMS.
So why do I have such a bee in the bonnet about TrustPilot and what does it have to do with search? The obvious issue is that TrustPilot uses a negative search result to create a need for their product.
It’s a mafia style protection racket. “Too bad about those broken windows” says the thug as they smash the glass. “But I think I can help you fix that.”
Let me be clear, I’d have little to no problem with TrustPilot if they were simply selling a product that helped companies deliver reviews to other platforms like Yelp or the Play Store.
The second reason is that a large number of people trust these ratings without knowing the details. I’m concerned that any ranking signal that is using click preference will be similarly trained.
The last reason is that Google has been rightly cracking down on the raft of MFA (Made for Adsense/Amazon) review sites that offered very little in the way of value to users. It was easy to ferret out these small spammy sites all with the same lists of products that would deliver the highest affiliate revenue.
Google got rid of all the corner dealers but they left the crime bosses alone.
I could paint a much darker portrait though. Google is simply a mirror.
Users were more prone to finger those scraggly corner dealers but are duped by the well dressed con man.
The Dark Forest
By now you’re probably sick and tired of search result screenshots and trying to determine the validity, size and scope of these problems.
I know I am. It’s exhausting and a bit depressing. What if this fatigue is happening when people are performing real Google searches?
Enter the Dark Forest Theory.
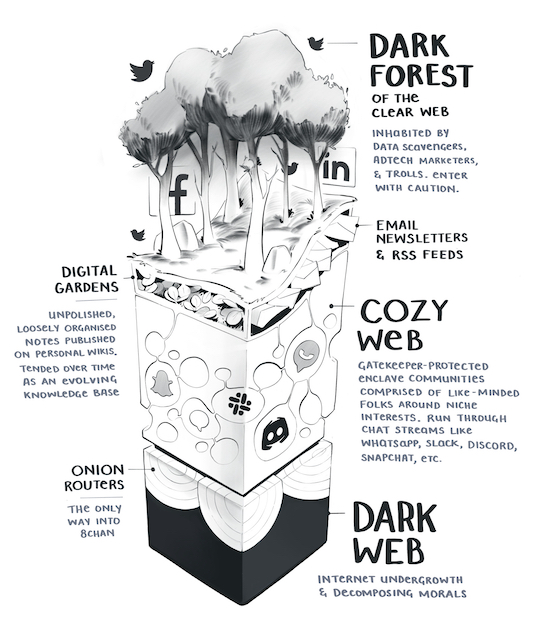
Illustration Credit: Maggie Appleton
In May of 2019 Yancey Strickler wrote The Dark Forest Theory of the Internet. I was probably late to reading it but ever since I did it’s been rattling around in my head.
In response to the ads, the tracking, the trolling, the hype, and other predatory behaviors, we’re retreating to our dark forests of the internet, and away from the mainstream.
Dark forests like newsletters and podcasts are growing areas of activity. As are other dark forests, like Slack channels, private Instagrams, invite-only message boards, text groups, Snapchat, WeChat, and on and on.
This is the atmosphere of the mainstream web today: a relentless competition for power. As this competition has grown in size and ferocity, an increasing number of the population has scurried into their dark forests to avoid the fray.
These are some of the passages that explained the idea of a retreat away from mainstream platforms. And while search isn’t mentioned specifically, I couldn’t help but think that a similar departure might be taking place.
Then Maggie Appleton did just that with The Expanding Dark Forest and Generative AI. It’s a compelling piece with a number of insightful passages.
You thought the first page of Google was bunk before? You haven’t seen Google where SEO optimizer bros pump out billions of perfectly coherent but predictably dull informational articles for every longtail keyword combination under the sun.
We’re about to drown in a sea of pedestrian takes. An explosion of noise that will drown out any signal. Goodbye to finding original human insights or authentic connections under that pile of cruft.
Many people will say we already live in this reality. We’ve already become skilled at sifting through unhelpful piles of “optimised content” designed to gather clicks and advertising impressions.
Are people really scurrying away from the dark forest of search?
In February, Substack reported 20 million monthly active subscribers and 2 million paid subscriptions. (And boy howdy do I like the tone of that entire post!)
Before Slack was scarfed up by Salesforce it had at least 10 million DAU and was posting a 39% increase in paid customers. In retrospect, I recently used a Slack channel to better research rank tracking options because search results were goog enough but ultimately unhelpful.
Discord has 150 million MAU and 4 billion daily server conversation minutes. While it began as a community supporting gamers, it’s moved well beyond that niche.
I also have a running Signal conversation with a few friends where we share the TV shows we’re watching and help each other through business and personal issues.
It’s hard to quantify the impact of these platforms. It reminds me a lot of the Dark Social piece by Alexis Madrigal. Perhaps we’ve entered an era of dark search?
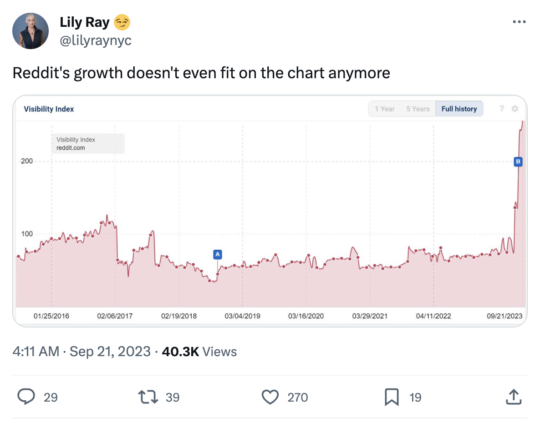
But a more well documented reaction has been the practice of appending the word ‘reddit’ to search queries. All of those pieces were from 2022. Today Google is surfacing reddit far more often in search results.
I’m not mad about this, unlike many other SEOs, because I think there is a lot of authentic and valuable content on reddit. It deserves to get more oxygen. (Disclaimer: reddit is one of my clients.)
Yet, I can’t help but think that Google addressed a symptom and not the cause.
Google took the qualitative (screeds by people that wound up on Hacker News) and quantitative (prevalence of reddit as a query modifier) and came to the conclusion that people simply wanted more reddit in their results.
Really, the cause of that reddit modifier was dissatisfaction with the search results. It’s an expression of the dark forest. They were simply detailing their work around. (It may also be a dissatisfaction with reddit’s internal search with people using Google by proxy to search reddit instead.)
Either way, at the end of the day, the main culprit is with search quality. And as I have shown above and as Maggie has pointedly stated, the results aren’t great.
They’re just goog enough.
Mix Shift
If people are running away from the dark forest, who is left to provide click data to these powerful signals. The last part of Yancey’s piece says it well.
The meaning and tone of these platforms changes with who uses them. What kind of bowling alley it is depends on who goes there.
Should a significant percentage of the population abandon these spaces, that will leave nearly as many eyeballs for those who are left to influence, and limit the influence of those who departed on the larger world they still live in.
If the dark forest isn’t dangerous already, these departures might ensure it will be.
Again, Yancey is talking more about social platforms but could a shift in the type of people using search change the click data in meaningful ways? A mix shift can produce very different results.
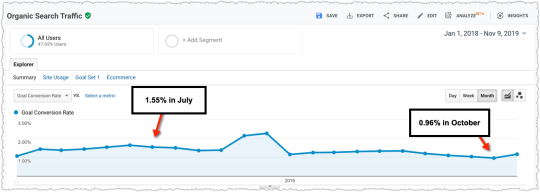
This even happens when looking at aggregate Google Search Console data. A client will ask how search impressions can go up but average rank go down. The answer is usually a page newly ranking at the bottom of the first page for a very high volume query.
It’s not magic. It’s just math.
The maturity of search and these defections can be seen on the Diffusion of Innovation Curve.
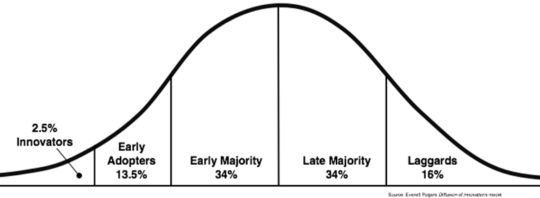
Google search is well into the laggards at this point. Your grandma is searching! Google has achieved full market saturation.
In the past, when people complained about Google search quality, I felt they were outliers. They might be SEOs or technologists, both highly biased groups that often have an ax to grind. They were likely in the Innovators category.
But 20 million Substack subscribers, Discord usage, the sustained growth of DuckDuckGo and Google’s own worries over Amazon, Instagram and TikTok makes it feel different this time. The defections from the dark forest aren’t isolated and likely come from both Early Adopters and Early Majority.
Google is learning from user interactions and those interactions are now generated by a different mix of individuals. The people who used Google in 2008 are different from those who use Google today.
If Google is simply a mirror, whose face are we seeing?
Information Asymmetry

Many of the examples I’m using above deal with the exploitation of information asymmetry.
Information asymmetry refers to a situation where one party in a transaction or interaction possesses more or better information compared to the other party. This disparity in knowledge can create an environment in which the party with more information can exploit their advantage to deceive or mislead the other, potentially leading to fraudulent activities.
Most users are unaware of the issues with the Forbes contributor model or how TrustPilot collects reviews and calculates rankings. It’s not that content explaining these things doesn’t exist. They do. But they are not prominently featured and are often wrapped in a healthy dose of marketing.
So users have to share some of the blame. Should Your Best Customers be Stupid? puts it rather bluntly.
Whether someone’s selling a data plan for a device, a retirement plan to a couple, or a surgical procedure to an ailing child’s parents, it’s unlikely that “smart” customers will prove equally profitable as “stupid” ones. Quite the contrary, customer and client segmentation based on “information asymmetries” and “smarts” strikes me as central to the future of most business models.
Is the current mix of search users less savvy about assessing content? Or in the context of the above, are the remaining search users stupid?
Sadly, the SEO industry is a classic example of information asymmetry. Most business owners and sites have very little idea of how search works or the difference between good and bad recommendations.
The reputation of SEOs as content goblins and spammers is due to the large number of people charging a mint for generic advice and white-label SEO tool reports with little added value.
Information asymmetry is baked into search. You search to find out information from other sources. So information asymmetry widens any time the information from those sources is manipulated or misrepresented.
Incentive Misalignment
Let’s return to those divisive U.S. News College Rankings. It parallels an ecosystem in which the incentives of parties aren’t aligned. In this instance, U.S. News wants to sell ads and colleges want to increase admissions, while prospective students are simply looking for the best information.
The problem here is that both U.S. News and colleges have economic incentives increasingly misaligned with student informational needs. While economic incentives can be aligned with informational needs, they can be compromised when the information asymmetry between them widens.
In this instance, U.S. News simply became the source of truth for college rankings and colleges worked to game those rankings. Students became reliant on one source that was increasingly gamed by colleges.
The information asymmetry grows because of the high degree of trust (perhaps misplaced) students have in both U.S. News and colleges. Unaware of the changes to information asymmetry, students continued to behave as if the incentives were still aligned.
Now go back and replace U.S. News with Google, colleges with sites (like Forbes or CNN) and students with search users.
Enshittification
Cory Doctorow has turned enshittification into a bit of an Internet meme. The premise of enshittification is that platforms are doomed to ruin their product as they continue to extract value from them.
Here is how platforms die: first, they are good to their users; then they abuse their users to make things better for their business customers; finally, they abuse those business customers to claw back all the value for themselves. Then, they die.
I think one of his better references is from the 1998 paper The Anatomy of a Search Engine by two gents you might recognize: Sergey Brin and Larry Page.
… we expect that advertising funded search engines will be inherently biased towards the advertisers and away from the needs of the consumers.
The entire section under Appendix A: Advertising and Mixed Motives essentially makes the case for the dangers of incentive misalignment. So if you don’t believe me, maybe you’ll believe the guys who created Google.
But we don’t really have to believe anything. We have data to back this up.
Ad Creep
There is no shortage of posts about the increasing prevalence of ads on search results.
Photo Credit: u/subject_cockroach636 via reddit
Anecdotes are easy to brush off as outliers and whiners. But, as they say, we have receipts.
In 2020, Dr. Pete Myers found that the #1 organic result started 616px down the page versus 375px in 2013. That’s a 64% increase.
But what about since 2020?
Nozzle.io shows that the percentage of space above the fold with a traditional ‘blue link’ decreased steeply at the end of 2021.
Nozzle takes the standard top of fold metric and looks at how much pixel space is dedicated to a true organic result.
It’s not always an ad as you can see above. But the fact remains that standard organic results are seeing less and less real estate going from ~11% to ~6% today.
SEOClarity has different methodology but shows an increasing lack of opportunity to rank organically above the fold.
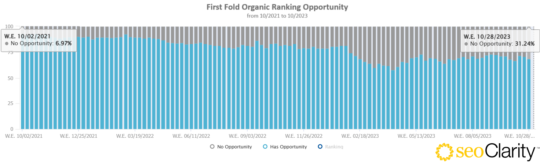
That’s from ~7% in October of 2021 to ~31% in October of 2023.
SEOClarity also shows the creep of product packs on mobile devices.
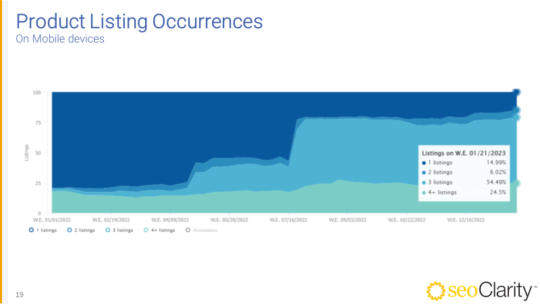
Here we see the expansion of product packs over the course of 2022, with an explosion of growth that ended with 79% SERPs with 3+ product packs.
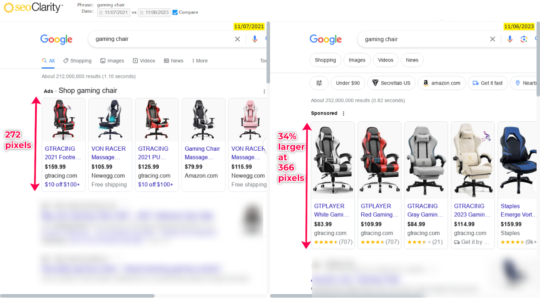
You encounter these as you continue to scroll through a search result. Many wind up being unpaid listings but a simple label could turn any of these into a sponsored feature. And there are so many of them on search results today.
Those product units? They’re also getting bigger. The products unit increased by 34% from 2021 to present.
Nozzle confirms the compounding nature of this issue by doing a pixel analysis of the entire SERP. It shows that products have seen a 600% increase in SERP real estate from ~1% to ~6% today.
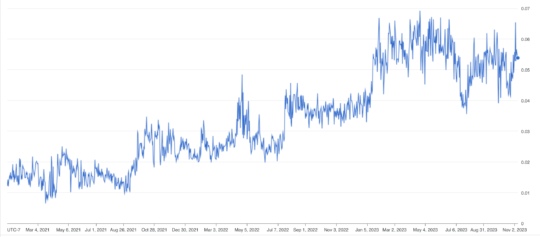
And in a 100K sample tracking by SEOClarity we can see the prevalence of Shopping Ads specifically has increased.
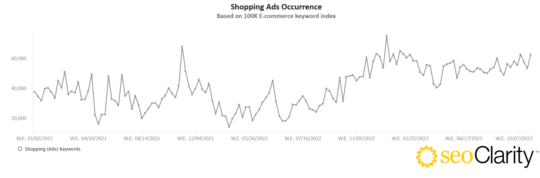
Of course you can see the spikes for the end of the year shopping spree but this year it’s like they just kept it on full blast.
And now they’re even testing putting ads in the middle of organic search results!
This seems like a pretty classic case of enshittification and what Google’s own founders cautioned against.
Context Switching and Cognitive Strain
The straw that might have broken the camel’s back and why this post exists is the decision by Google to remove indented results from search results.
I know, crazy right?
Now, for those not in the know, when a site had two or more results for a query Google would group them together, indenting the additional results from the same site. This was a great UX convention, allowing users to sort similar information and select the best from that group before moving on to other results.
But now that indentation is gone. But it gets worse! Google isn’t even keeping results from the same site together anymore. You wind up with search results where you could encounter the same site twice or more but not consecutively.
I guess it’s goog enough for users.
But is it really? Let’s use an offline analogy and pretend I’m making fruit salad.
I go to the store and visit the produce section. There I find each type of fruit in a separate bin. Apples in one, oranges in another so on and so forth. I can quickly and easily find the best of each fruit to include in my salad. That is the equivalent of what search results are like with indented results.

Photo Credit: Shutterstock
Without indented results? I’d go to the store and visit the produce section where I’d find one gigantic bin with all the fruit mixed together. I have to look at an apple, find it’s not what I’m looking for, then find an orange I like, then look at a pear, then find another orange that I don’t need because I already found one, then another pear, then another orange I don’t need, then a pineapple.
I’m sorry, but in no world is this a good user experience. It’s such a foreign concept I gave up getting DALL-E to render a mixed up produce aisle.
Clutter
Do search results spark joy? There is no question that search results have become cluttered. Even as something as simple as a t-shirt query.
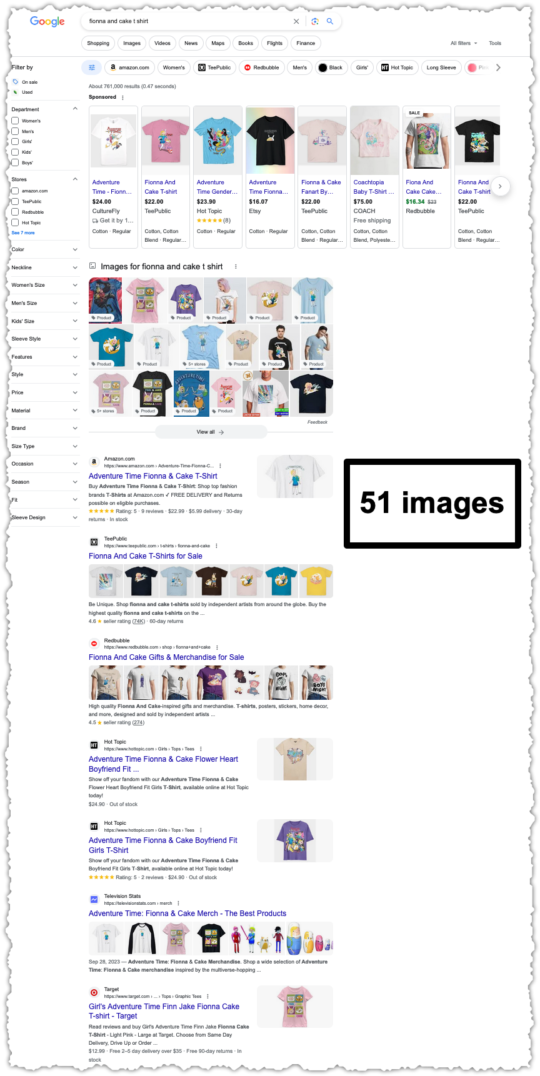
There are 51 individual images pictured above. I understand the desire to make results more visual. But this strikes me as a kitchen sink approach that may run afoul of The Paradox of Choice. And this example is just the tip of the iceberg.
Even Google agrees and has started to sunset SERP features.
To provide a cleaner and more consistent search experience, we’re changing how some rich results types are shown in Google’s search results. In particular, we’re reducing the visibility of FAQ rich results, and limiting How-To rich results to desktop devices. This change should finish rolling out globally within the next week.
All of these UX changes have a material impact on the evaluation of interaction data. Google says it best.
Growing UX complexity makes feedback progressively harder to convert into accurate value judgments :-(
You know what hasn’t changed? People’s affinity for brands. So if other user interaction data is becoming harder to parse given the UX complexity does the weight of less complex user interaction data (such as Navboost) grow as a result?
Google Org Structure
Why does it all feel different now? Some of it may be structural.
Amit Singhal was the head of Google search from 2001 until 2016, when he departed under controversy. These were the formative years of Google and is the search engine I certainly think of and identify with when I think of Google.
Following Singhal was John Giannandrea, who employed an AI first approach. His tenure seemed rocky and ended quickly when Giannandrea was hired away by Apple in 2018.
Stepping in for Giannandrea was Ben Gomes, a long-time Google engineer who was more closely aligned with the approach Singhal took to search quality. I’ve seen Ben speak a few times and met him once. I found him incredibly smart yet humble and inquisitive at the same time.
But Ben’s time at the top was short. In June of 2020 Ben moved to Google Education, replaced by Prabhakar Raghavan, who had been heading up Google Ads.
Here’s where it gets interesting. When Raghavan took the role he became head of Google Search and Google Ads. It is the first time in Google’s history that one person would oversee both departments. Historically, it was a bit like the division between church and state.
That set off alarm bells in my head as well as others as detailed on Coywolf News.
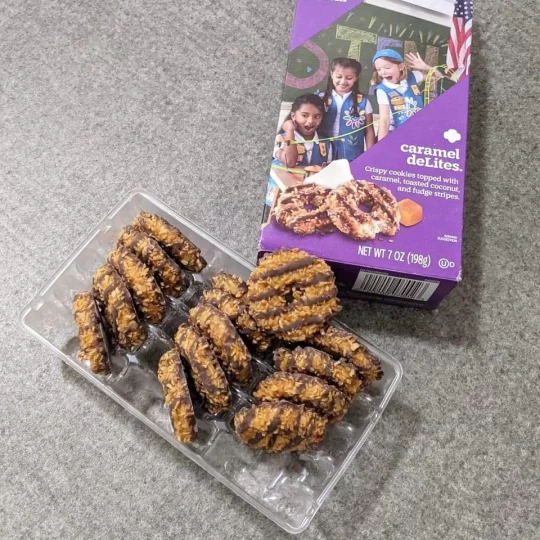
Photo Credit: u/boo9817 via reddit
Even if your intentions are pure I felt it would be difficult not to give into temptation. It’s like Girl Scout cookies. You can’t have a box of Samoas lying around the house tempting you with their toasted coconut chocolatey-caramel goodness.
Your only defense is to not have them in the house at all. (Make a donation to the Girl Scouts instead.)
But what if you were the Girl Scout leader for that troop? You’ve been working pretty hard for a long time to ensure you can sell a lot of cookies. They’re stacked in your living room. Could that make it even tougher not to indulge?
Email from Benedict Gomes (Google) to Nick Fox (Google), Re: Getting ridiculous.. (Feb. 6, 2019) (pdf) shows the concern Gomes had with search quality getting too close to the money.
I think it is good for us to aspire to query growth and to aspire to more users. But I think we are getting too involved with ads for the good of the product and company
A month later there’s B. Gomes Email to N. Fox, S. Thakur re Ads cy (Mar. 23, 2019) (pdf), which contains an unsent reply to Raghavan that generally explains how Gomes believes search and short-term ad revenue are misaligned. It’s a compelling read.
Yet, a year later Raghavan had the top job. Now this could be an ice cream and shark attacks phenomenon. But either way you slice it, we’ve gotten more ads and a more cluttered SERP under the Raghavan era.
ChatGPT

You thought you could escape a piece on the state of search without talking about generative content? C’mon!
I’m not a fan. Services like ChatGPT are autocomplete on steroids, ultimately functioning more like mansplaining as a service.
They don’t really know what they’re talking about, but they’ll confidently lecture you based on the most generic view of the topic.
What Is ChatGPT Doing … and Why Does It Work? is a long but important read, which makes it clear that you’ll always get the most probable content based on its training corpus.
The loose translation is that you’ll always get the most popular or generic version of that topic.
Make no mistake, publishers are exploring the use of generative AI to create or assist in the writing of articles. Pioneers were CNET, who was in the crosshairs for the use of generative content soon after ChatGPT launched. Fast forward to today and it’s a Gannett site found to be using AI content.
Publishers have clear economic incentives to use generative AI to scale the production of generically bland content while spending less. (Those pesky writers are expensive and frequently talk back!)
I see the flood of this content hitting the Internet bad in two ways for Google search. First, unsophisticated users don’t understand they’re getting mediocre content. They are unaware the content ecosystem has changed, making the information asymmetry a chasm.
More dangerous, sophisticated users may be aware the content ecosystem has changed and will simply go to ChatGPT and similar interfaces for this content. If Google is full of generic results, why not get the same result without the visual clutter and advertising avalanche?
This doesn’t seem far-fetched. ChatGPT was the fastest-growing consumer application in history, reaching 100 million users two months after launch.
Groundhog Day

We’ve been here before. I wrote about this topic over 12 years ago in a piece titled Google Search Decline or Elitism?
Google could optimize for better instead of good enough. They could pick fine dining over fast food.
But is that what the ‘user’ wants?
Back then the complaints were leveled at content farms like Mahalo, Squidoo and eHow among others.
Less than a month after I wrote that piece Google did choose to optimize for better instead of goog enough by launching the Panda update. As a result, Mahalo and Squidoo no longer exist and eHow is a shadow of what it once was.
Is ChatGPT content the new Demand Media content farm?
Editorial Responsibility
A recent and rather slanted piece on the Verge did have one insight from Matt Cutts, a former Google engineer who I sorely miss, that struck a chord.
“There were so many true believers at Google in the early days,” Cutts told me. “As companies get big, it gets harder to get things done. Inevitably, people start to think about profit or quarterly numbers.” He claimed that, at least while he was there, search quality always came before financial goals, but he believes that the public underestimates how Google is shaping what they see, saying, “I deeply, deeply, deeply believe search engines are newspaper-like entities, making editorial decisions.”
The last sentence really hits home. Because even if I have the reasons for Forbes, CNN, U.S. News and others ranking wrong, they are ranking. One way or the other, that is the editorial decision Google is making today.
If my theory that Google is relying too much on brands through user preference is right, then they’re essentially abdicating that editorial decision.
They’re letting the inmates run the asylum.
Food Court Search Results

Photo Credit: Shutterstock
Any user interaction data from a system this broken will become increasingly unreliable. So it’s no surprise we’re seeing a simulacrum of content, a landscape full of mediocre content that might seem tasty but isn’t nutritional.
Search results are becoming the equivalent of a shopping mall food court. Dark forest migrants avoid the shopping mall altogether while those that remain must choose between the same fast food chains: Taco Bell, Sbarro, Panda Express, Subway and Starbucks.
You won’t get the best meal or coffee when visiting these places but it’s consistently … okay.
It’s goog enough!
From Goog Enough To Great
So how could Google address the yawning information asymmetry and incentive misalignment responsible for goog enough results? There’s no doubt they can. They have incredibly talented individuals who can tackle these issues in ways far more sophisticated than I’m about to suggest.
Refactor Interaction Signals
Google had a difficult task to combat misinformation after the last election cycle and COVID pandemic. It seems like they relied more heavily on user interaction signals and our affinity for brands to weed out bad actors.
This reminds me of Google’s Heisenberg Problem, a piece I wrote more than 13 years ago (I swear, I don’t feel that old). The TL;DR version is that the very act of measuring a system changes it.
User interaction signals are important but the value judgments made on them probably needs to be refactored in light of sites exploiting brand bias.
Rollback Ad Creep
Google’s own founders thought advertising incentives would not serve the needs of the consumer.
Ben Gomes wrote that “… the best defense against query weakness is compelling user experiences that makes users want to come back.” but “Short term revenue has always taken precedence.”
Someone may not make their OKRs and ‘the street’ (which I imagine to be some zombie version of Gordon Gecko) won’t like it. But Google could fall into the Blockbuster Video trap and protect a small portion of profits at the expense of the business.
Reduce UX Clutter
Some Google features are useful. Some not so much. But sometimes the problem is the sheer volume of them on one page.
This isn’t about going back to 10 blue links, this is about developing a less overwhelming and busy page that benefits consumers and allows Google to better learn from user interactions.
Deploy Generative Content Signals
Google is demoting unhelpful content through their Helpful Content System. It’s a great start. But I don’t think Google is truly prepared for the avalanche of generative content from both low-rent SEOs and large-scale publishers.
A signal for generative content should be used in combination with other signals. Two documents with similar scores? The one with the lower generative content score would win. And you can create a threshold where a site-wide demotion is triggered if too much of the corpus has a high generative content score.
Create Non-Standard Syntax Signals
Instead of looking for generative content, could Google create signals designed to identify human content. Maggie has a great section on this in her piece.
No language model will be able to keep up with the pace of weird internet lingo and memes. I expect we’ll lean into this. Using neologisms, jargon, euphemistic emoji, unusual phrases, ingroup dialects, and memes-of-the-moment will help signal your humanity.
This goes beyond looking for first person syntax and instead would look for idiosyncrasies and text flourishes that acted as a sort of human fingerprint.
Improve Document Signals
It’s clear that Google is better at understanding documents today through innovations like BERT, PaLM 2 and Passage Ranking to name a few. But these are all still relatively new signals that should and need to get better over time.
The October 2023 Google Core Algorithm Update (gosh the naming conventions have gotten boring) seemed to contain a change to one of these document signals which elevated content that had multiple repetitions of the same or similar syntax.
I could suggest a few more but I think this is probably … goog enough.
Disclaimer and Notes: I consult with reddit, Pinterest, WalletHub and Everand, all sites mentioned or linked to in this piece. Auditory accompaniment while writing was limited to two studio LPs by the Chemical Brothers: No Geography and For That Beautiful Feeling. A big thank you to Mitul Gandhi and Derek Perkins who both shared data with me on very short notice.