Clients and even conference presenters are using Google Search Console’s position wrong. It’s an easy mistake to make. Here’s why you should only trust position when looking at query data and not page or site data.
Position
Google has a lot of information on how they calculate position and what it means. The content here is pretty dense and none of it really tells you how to read and when to rely on the position data. And that’s where most are making mistakes.
Right now many look at the position as a simple binary metric. The graph shows it going down, that’s bad. The graph shows it going up, that’s good. The brain is wired to find these shortcuts and accept them.
As I write this there is a thread about there being a bug in the position metric. There could be. Maybe new voice search data was accidentally exposed? Or it might be that people aren’t drilling down to the query level to get the full story.
Too often, the data isn’t wrong. The error is in how people read and interpret the data.
The Position Problem
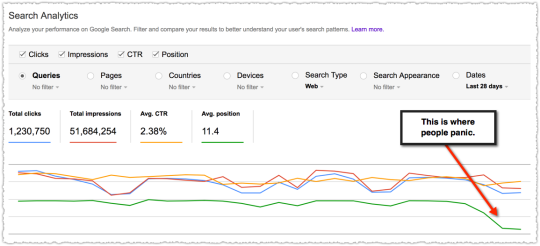
The best way to explain this is to actually show it in action.
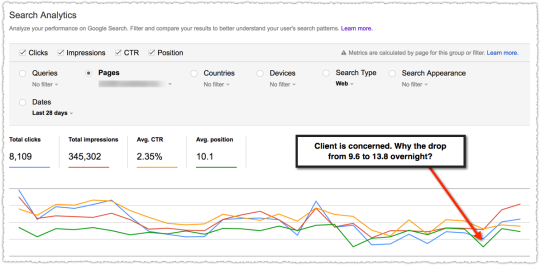
A week ago a client got very concerned about how a particular page was performing. The email I received asked me to theorize why the rank for the page dropped so much without them doing anything. “Is it an algorithm change?” No.
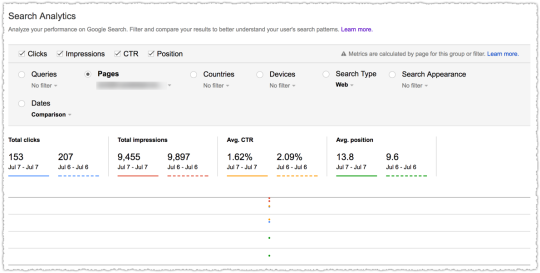
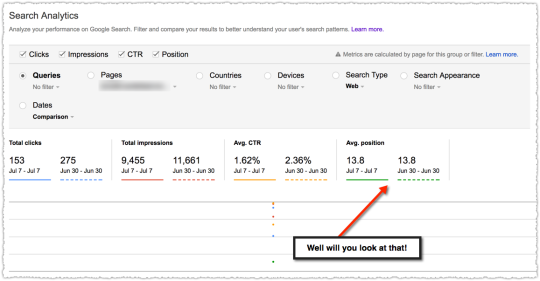
If you compare the metrics day over day it does look pretty dismal. But looks can be deceiving.
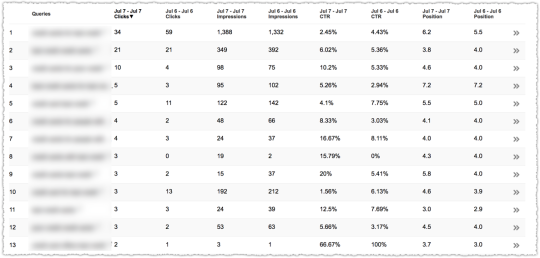
At the page level you see data for all of the queries that generated an impression for the page in question. A funny thing happens when you select Queries and look at the actual data.
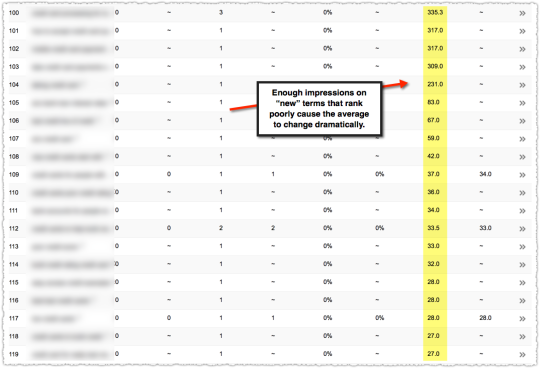
Suddenly you see that on July 7th the page received impressions for queries that were not well ranked.
It doesn’t take a lot of these impressions to skew your average position.
A look at the top terms for that page shows some movement but nothing so dramatic that you’d panic.
Which brings us to the next flaw in looking at this data. One day is not like the other.
July 6th is a Thursday and July 7th is a Friday. Now, usually the difference between weekdays isn’t as wide as it is between a weekday and a weekend but it’s always smart to look at the data from the same day in the prior week.
Sure enough it looks like this page received a similar expansion of low ranked queries the prior Friday.
There’s a final factor that influences this analysis. Seasonality. The time in question is right around July 4th. So query volume and behavior are going to be different.
Unfortunately, we don’t have last year’s data in Search Analytics. These days I spend most of my time doing year over year analysis. It makes analyzing seasonality so much easier. Getting this into Search Analytics would be extremely useful.
Analyzing Algorithm Changes
The biggest danger comes when there is an algorithm change and you’re analyzing position with a bastardized version of regex. Looking at the average position for a set of pages (i.e. – a folder) before and after an algorithm change can be tricky.
The average position could go down because those pages are now being served to more queries. And in those additional queries those pages don’t rank as high. This is actually quite normal. So if you don’t go down to the query level data you might make some poor decisions.
One easy way to avoid making this mistake is to think hard when you see impressions going up but position going down.
When this type of query expansion happens the total traffic to those pages is usually going up so the poor decision won’t be catastrophic. It’s not like you’d decide to sunset that page type.
Instead, two things happen. First, people lose confidence in the data. “The position went down but traffic is up! The data they give just sucks. You can’t trust it. Screw you Google!”
Second, you miss opportunities for additional traffic. You might have suddenly broken through at the bottom of page one for a head term. If you miss that you lose the opportunity to tweak the page for that term.
Or you might have appeared for a new query class. And once you do, you can often claim the featured snippet with a few formatting changes. Been there, done that.
Using the average position metric for a page or group of pages will lead to sub-optimal decisions. Don’t do it.
Number of Queries Per Page

This is all related to an old metric I used to love and track religiously.
Back in the stone ages of the Internet before not provided one of my favorite metrics was the number of keywords driving traffic to a page. I could see when a page gained enough authority that it started to appear and draw traffic from other queries. Along with this metric I looked at traffic received per keyword.
These numbers were all related but would ebb and flow togther as you gained more exposure.
Right now Google doesn’t return all the queries. Long-tail queries are suppressed because they’re personally identifiable. I would love to see them add something that gave us a roll-up of the queries they aren’t showing.
124 queries, 3,456 impressions, 7.3% CTR, 3.4 position
I’d actually like a roll-up of all the queries that are reported along with the combined total too. That way I could track the trend of visible queries, “invisible” queries and the total for that page or site.
The reason the number of queries matters is that as that page hits on new queries you rarely start at the top of those SERPs. So when Google starts testing that page on an expanded number of SERPs you’ll find that position will go down.
This doesn’t mean that the position of the terms you were ranking for goes down. It just means that the new terms you rank for were lower. So when you add them in, the average position declines.
Adding the roll-up data might give people a visual signpost that would prevent them from making the position mistake.
TL;DR
Google Search Console position data is only stable when looking at a single query. The position data for a site or page will be accurate but is aggregated by all queries.
In general, be on the look out for query expansion where a site or page receives additional impressions on new terms where they don’t rank well. When the red line goes up and the green goes down that could be a good thing.
The Next Post: Google Index Coverage Report
The Previous Post: Ignoring Link Spam Isn’t Working

2 trackbacks/pingbacks
Comments About Analyzing Position in Google Search Console
// 18 comments so far.
Carine // July 18th 2017
Hi AJ, Thanks for the detailed article. In regards to the position drop, I noticed that selecting the targeted country seemed to help returning more accurate data for us, unsure why!
Tony McCreath // July 19th 2017
You can work out invisible queries by comparing the totals with summing up the individual query counts.
I’m currently analysing a lot of exported data. I’ve not fully verified things but it looks like the invisible queries (not provided) are a lot higher than I thought.
AJ Kohn // July 19th 2017
You’re absolutely right Tony. I’ve done that math a number of times. The amount that’s invisible varies widely. For the page in question in this example, only 14% of the clicks and 19% of the impressions are invisible.
Unfortunately we don’t know how many queries there are in that invisible portion. I’d really like that piece of data. Also, many make a mistake in the position for the visible data by averaging the position instead of using a weighted average.
Frank Sandtmann // July 19th 2017
AJ, I do agree that is very important to watch out for mentioned pitfalls, when interpreting Seach Console data. Of course, it is a much better strategy to base decisions on long term data, rather than acting on short term (and posibly random) changes.
What we are seeing since the second half of last week in Search Console, however, is to my understanding rather a change on Google´s side. For the websites I am tracking I am seeing generally this pattern: positions going down, impressions going up, higher number of queries. As you pointed out, this could be – generally speaking – a good sign, as more search terms are entering the SERPs. Usually on lower positions (or “invisible” as you put it), and thus negatively influencing the reported average position.
I am seeing this development not only in total, but also for individual countries. So with respect to the recent changes in week 29 I am leaning towards an algorithmic change by Google rather than a bug or misinterpretation. But time will tell …
AJ Kohn // July 19th 2017
Correct Frank. If you dig into the data for the last week or so you start to see sites rank for new terms – head terms in some cases. I can confirm that I see a bunch of this internationally as well. I know a bit more about that which I can’t share.
Suffice to say, I see this as more evidence of an algorithmic change. And that’s why I think understanding how to read this data is so important. If you look at the data and say “it’s a bug” instead of looking at it and saying “whoa, something big just happened” then you’re bound to fall behind.
Jim Robinson // July 19th 2017
Totally agree and it’s often challenging to explain this to clients who like to zero in that that average position metric. Average position only makes sense on a per query basis. Ranking for more keywords = good!, but it almost always means average position goes down, as least in the short term.
AJ Kohn // July 19th 2017
Exactly Jim. On a per query basis position is a fine metric to track over time. (I do hate the “it dropped from 4.0 to 4.2 yesterday” mentality.)
Ranking for more keywords is very good but it always starts with a lower position on those new keywords. That’s just how it works. When we had full visibility in Google Analytics you could track this like clockwork. Now … seems many have forgotten this is how it works.
Steve // July 20th 2017
Useful article, and I agree entirely.
But the drop in average ranking could also be due to a change in Google’s logging system.
AJ Kohn // July 20th 2017
Steve,
It was, in large part, due to a change in the logging system. But if you were looking at the data you could tell something like this happened. Whether it was this feature enhancement or an algorithm change was up in the air. Looking at the data I’d say it’s more the former but there’s a bit of the latter as well.
Dan Charles // July 28th 2017
I particularly agree with you on seasonality and it would be awesome if I had more control over these comparisons too.
Really great insights here. I’ve found the highly skewed positioning in SC to be even more prominent on new sites where they tend to have a lot of keywords in the index, but all in the lower pages 2 to 7. It really does help to drill down to the data in these cases otherwise I can’t refine my targeting effectively.
Val // July 28th 2017
This was brilliant. I understand the concept, but never applied it at such a granular level. My client just dropped from an 18 position average to 30, once inspected, turns out she is getting huge impressions for queries she never would have previously ranked for. It brought the average position down. Now I have to get to work and improve her ranking for that term.
Dom // July 31st 2017
As someone who users webmaster tools quite often, this is helpful. I have been recently trying to figure out why a few keywords have been going down in ranking in WMTs. I will have to use your method to see if low ranked queries are skewing the data. I am going to guess they are as I don’t think I have noticed any huge drops in traffic for the pages in question.
Abdul here // August 10th 2017
Hy AJ,
first thanks for discussing this topic in detail. my question is what about pages with limited search queries? or pages with product specific? like page for “cartridge for HP Ink Jet printer” might not have long list of search queries…
Can we use aggregate data for such pages. because you know, everyone can not monitor rankings of thousands of keywords!
Virginia Parra // October 04th 2017
Thanks AJ, I found this super interesting and yeah, I’ve definitely been looking at the data wrong quite a few times but will be paying much closer attention to it now thanks to the tips and the simple explaining. Although I’m usually pretty aware of it, I’ve got to admit that at times it takes some talking myself into the fact that yes, usually the data is not wrong, we’re reading it and interpreting wrong.
Bill Scully // October 06th 2017
Hi AJ,
Great article. I never thought of using search console to identify new low ranking head terms and pivoting. I’ve always used it for evaluating the set of terms and matched page I’m focused on. What a great idea!
As far as the rest of the article, I totally agree, we rely way too much on averages, average page speed, average conversion rate, our average lifetime values, etc.
The problem with averages is that they tell you nothing about what’s working or not working. As practitioners, we should always be drilling down and segmenting to help prioritize our SEO efforts.
Vince Arnone // October 16th 2017
Hey AJ, thanks for the insightful post. This is an issue I’ve run into before but never explained in such a detailed way.
It’s always stressful to have to explain these types of situations to clients, and even tougher to get them to look at the big picture rather than the granular data. Thanks for this awesome writeup.
Kosyo Ivanov // November 01st 2017
Had something like that happening to a site I mange a few weeks ago. The average position went from 21 to 100 in a day. Impressions, however, went up 650 times. Gave me a bit of scare there for a second but in general, these are the times you can make the most out of the query info you get.
I don’t know if you’ve come across this, but there was a survey by John Mueller I think, asking for GSC recommendations a few months back. We might get lucky and see some changes soon.
Olivia // March 14th 2018
Great post and very helpful to identify positions dropping. I am an SEO consultant and this type post is always like a treasure for work.
Sorry, comments for this entry are closed at this time.
You can follow any responses to this entry via its RSS comments feed.