A lot of my work is on large consumer facing sites. As such, they get a tremendous amount of long-tail traffic. That’s right, long-tail search isn’t dead. But you might think so when you look at Google Search Console.
I’ve found there’s more data in Google Search Console than you might believe. Here’s what I’m doing to track hidden long-tail search traffic.
Traffic Hazards
The first step in understanding how to track long-tail search is to make sure you’re not making mistakes in interpreting Google Search Console data.
Last year I wrote about the dangers of using the position metric. You can only use it reliably when looking at it on the query level and not the page level.
Today, I’m going the other direction. I’m looking at traffic by page but will be doing so to uncover a new type of metric – hidden traffic.
Page Level Traffic
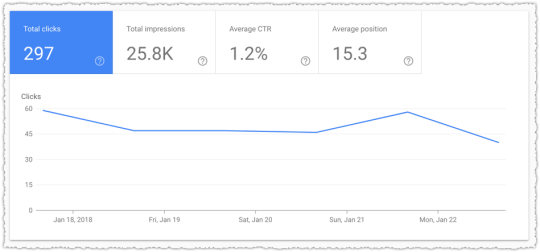
The traffic for a single page in Google Search Console is comprehensive. That’s all the traffic to a specific page in that time frame.
But a funny thing happens when you look at the query level data below this page level data.
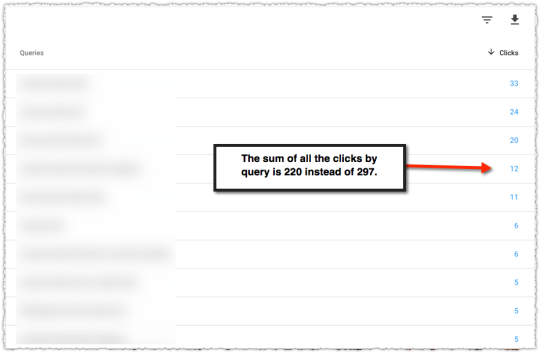
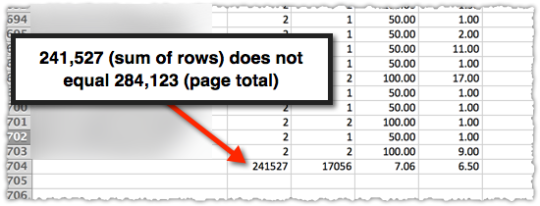
The numbers by query do not add up to the page level total. I know the first reaction many have is to curse Google and write off the data as being bad. But that would actually be a bad idea.
The difference between these two numbers are the queries that Google is suppressing because they are either too small and/or personally identifiable. The difference between the page total and visible total is your hidden long-tail traffic.
Calculating Hidden Traffic
Finding the amount of hidden long-tail traffic turns out to be relatively easy. First, download the query level data for that page. You’ll need to make sure that you don’t have more than 1,000 rows or else you won’t be able to properly count the visible portion of your traffic.
Once downloaded you calculate the visible total for those queries.
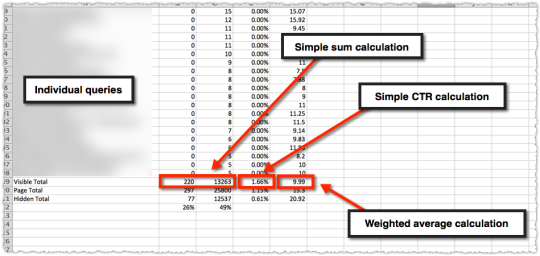
So you’ll have a sum of clicks, sum of impressions, a calculated clickthrough rate and then calculate a weighted average for position. The latter is what seems to trip a lot of folks up so here’s that calculation in detail.
=SUMPRODUCT(Ex:Ex,Cx:Cx)/SUM(Cx:Cx)
What this means is you’re getting the sum product of impressions and rank and then dividing that by the sum of impressions.
Next you manually put in the page total data we’ve been provided. Remember, we know this represents all of the data.
The clicks are easy. The impressions are rounded in the new Search Console. I don’t like that and I hope it changes. For now you could revert to the old version of search console if you’re only looking at data in the last 90 days.
(Important! The current last 7 days option in Search Console Beta is actually representative of only 6 days of data. WTF!)
From there I calculate and validate the CTR. Last is the average position.
To find the hidden long-tail traffic all you have to do is subtract the visible total from the page total. You only do that for clicks and impressions. Do not do that for CTR folks. You do the CTR calculation on the click and impression numbers.
Finally, you calculate the weighted position for the hidden traffic. The latter is just a bit of algebra at the end of the day. Here’s the equation.
=((C110*E110)-(C109*E109))/C111
What this is doing is taking the page total impressions * page total rank – visible page total impressions * visible page total rank and dividing that by the hidden page total impressions to arrive at the hidden page total rank.
The last thing I’ve done here is determine the percentage of clicks and impressions that are hidden for this page.
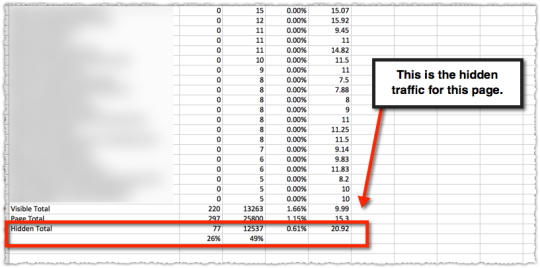
In this instance you can see that 26% of the traffic is hidden and … it doesn’t perform particularly well.
Using The Hidden Traffic Metric
This data alone is interesting and may lead you to investigate whether you can increase your long-tail traffic in raw numbers and as a percentage of total traffic. It can be good to know what pages are reliant on the more narrow visible queries and what pages draw from a larger number of hidden queries.
In fact, when we had full keyword visibility there was a very predictable metric around number of keywords per page that mapped to increases in authority. It still happens today, we just can’t easily see when it happens.
But one of the more interesting applications is in monitoring these percentages over time.
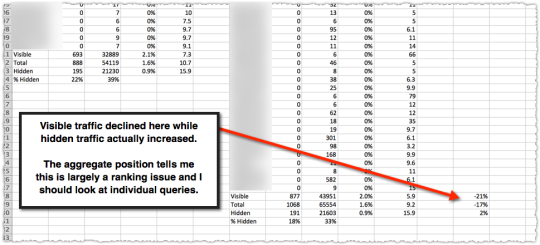
What happens to these metrics when a page loses traffic. I took two time periods (of equal length) and then determined the percentage loss for visible, total and hidden.
In this instance the loss was almost exclusively in visible traffic. The aggregate position number (dangerous to rely on for specificity but good for finding the scent of a problem) leads me to believe it’s a ranking problem for visible keywords. So my job is to look at specific keywords to find which ones dropped in rank.
What really got me curious was when the opposite happens.
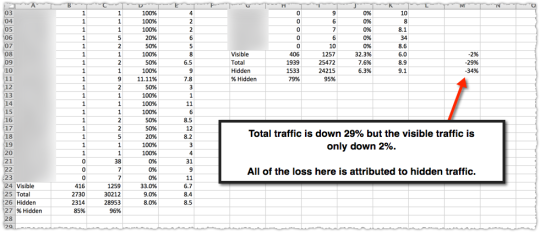
Here the page suffered a 29% traffic loss but nearly all of it was in hidden traffic. My job at that point is to figure out what type of long-tail queries suddenly evaporated. This isn’t particularly easy but there are clues in the visible traffic.
When I figured it out things got very interesting. I spent the better part of the last three months doing additional analysis along with a lot of technical reading.
I’ll cover the implications of changes to hidden traffic in my next post.
Caveats and Traps

This type of analysis is not particularly easy and it does come with a fair number of caveats and traps. The first is the assumption that the page level data we get from Google Search Console is accurate and comprehensive. I’ve been told it is and it seems to line up to Google Analytics data. #ymmv
The second is that the data provided at the query level is consistent. In fact, we know it isn’t since Google made an update to the data collection and presentation in July of 2017.
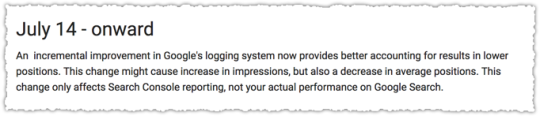
Mind you, there were some other things that happened during that time and if you were doing this type of analysis then (which is when I started in earnest) you learned quite a bit.
You also must select a time period for that page that doesn’t have more than 1,000 visible queries. Without knowing the total visible query total you can’t calculate your hidden total. Finding the right timeframe can sometimes be difficult when looking at high volume pages.
One of the traps you might fall into is assuming that the queries in each bucket remain stable. That’s not always the case. Sometimes the composition of visible queries changes. And it’s hard to know whether hidden queries were promoted to visible or vice versa.
There are ways to control for some of this in terms of the total number of visible terms along with looking at not just the raw change in these cohorts but the percentage changes. But it can get messy sometimes.
In those situations it’s down to interpretation. Use that brain of yours to figure out what’s going on.
Next Steps and Requests

I’ve been playing with this metric for a while now but I have yet to automate the process. Adjacent to automation is the 1,000 visible query limit, which can be eliminated by using the API or tools like Supermetrics and/or Data Studio.
While performing this analysis on a larger set of pages would be interesting, I’ve found enough through this manual approach to keep me busy. I’m hopeful that someone will be excited to do the work to automate these calculations now that we have access to a larger data set in Google Search Console.
Of course, none of that would be necessary if Google simply provided this data. I’m not talking about the specific hidden queries. We know we’re never getting that.
Just give us a simple row at the end of the visible query rows that provides the hidden traffic aggregate metrics. An extra bonus would be to tell us the number of keywords that compose that hidden traffic.
After publishing this, John Mueller reminded me that this type of presentation is already integrated into Google Analytics if you have the Search Console integration.
It’s been shown like that in @googleanalytics for a long time now, FWIW 🙂
— John ☆.o(≧▽≦)o.☆ (@JohnMu) January 26, 2018
The presentation does most of what is on my wishlist.
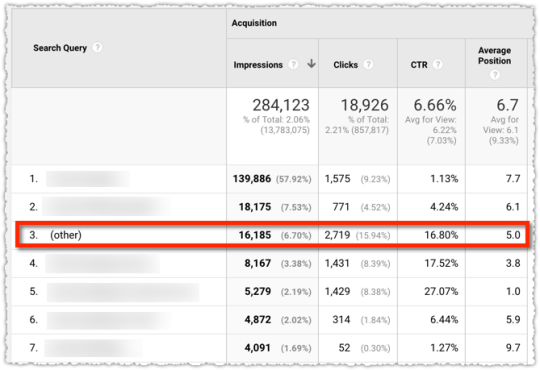
Pretty cool right? But it would be nice if (other) instead said (167 other search queries). The real problem with this is the data. It’s not comprehensive. Here’s the downloaded data for the page above including the (other) row.
It’s an interesting sub-set of the hidden queries but it’s incomplete. So fix the data discrepancy or port the presentation over into search console and we’re good. :-)
TL;DR
You can track hidden long-tail search traffic using Google Search Console data with some straight-forward math. Understanding and monitoring hidden traffic can help diagnose ranking issues and other algorithmic shifts.
The Next Post: Algorithm Analysis In The Age of Embeddings
The Previous Post: What I Learned in 2017

2 trackbacks/pingbacks
Comments About Tracking Hidden Long-Tail Search Traffic
// 9 comments so far.
Trond // January 26th 2018
Hi AJ. Excellent post. I´ve had unlimited number of lines in GSC/GWT on my wishlist for years, every Christmas. Dealing with enterprise SEO clients means you NEED Supermetrics. Without it you will NOT get the long-tail keywords. Since Google Search Console won´t give you all. With Supermetrics I can easily extract 100k lines from Google Search Console instead. Personally I break down each level in the URL hierarchy and bind kw´s to each level if it´s a huge site and it´s needed, even with tools like Supermetrics. Wishing I didn´t have to do this. Instead, I would prefer to have in one place 🙂
AJ Kohn // January 26th 2018
Thanks for the comment Trond.
Yes, to get more data out of GSC you need the API or additional third-party tools. I’ve been lucky that most clients utilize the API.
But even looking at that expanded data what I found was that the ‘hidden’ keyword data was often more interesting. It reminded me of the WWII airplane bullet hole story. This was just my way of exploring how to quantify and track it.
LL // January 30th 2018
On this same train of thought, you mentioned using Data Studio to extract the “extra” data as well. Is this in place of using an API? Or did you just use Data Studio to visualize and Supermetrics as the connector?
AJ Kohn // January 30th 2018
LL,
What’s displayed in the post is 100% Google Search Console data without the use of Data Studio, the API or Supermetrics. Data Studio has the ability to download all rows so you can use that but the flexibility there might be limited. Supermetrics would simply be a third-party tool that utilizes the API if you don’t want to roll your own.
Mike // January 31st 2018
Can you clarify something: I believe the API still limits data, generally to the Top 1000 queries per search console profile. Is that what you are seeing?
AJ Kohn // January 31st 2018
Mike,
The Search Console API should give you 5,000 rows and you can get more by incrementing the startRow value.
Bill Scully // February 19th 2018
Hi AJ,
Thanks for this great post! I didn’t realize the impressions are rounded in the new Search Console.
I’ve been doing a lot with Google Search Console lately. But I can’t picture what a report like this would look like. What would be your top requirements?
Tony McCreath // March 25th 2018
The API does have the 5,000 limit and the ability to page with startRow. However it fails as the data is not properly sorted. Typically much data after 5,000 has a value of 1 and from that is randomly sorted. So the same row could show up on page 2, 3, 6, 7 etc. Making it hard to get a clean set of full results.
I’ve found that doing single day queries can avoid the 5,000 limit in most cases. If not, people have sub divided again. e.g. using the first letter in the query and going a to z.
I also was playing with identifying what I called “not provided” keywords. I was surprised how high a percentage it was. 15% of impressions and over 20% of clicks from a sample of 200 million impressions. I still need to find the time to verify and dig deeper into the data.
Philip Elias // April 29th 2018
Hey AJ, really interesting post. Thank you for the step-by-step instructions, as this made it super easy for me to replicate the process with my GSC data.
I currently database my GSC data as you alluded to and query it via SQL, so I am able to see more than what the default online module gives us. Here is what I did and wanted to share some findings with you:
1. Downloaded query-level data for a landing page and a given time range, following your instructions above. Found that about 23% of my clicks were Hidden.
2. Queried in SQL that same query-level data for the landing page and time range.
3. Found that I got an additional ~40 keywords of data from this vs. the online GSC data.
Here’s where a couple of interesting points stick out:
4. My total clicks for my database-queried data (sum of search query clicks) were about about 1% off of Page Total Clicks when downloaded from GSC. So close, but looks like some sort of data discrepancy.
5. Also, the 40 additional keywords that my databased data had did not have enough clicks to add up to the 23% Hidden clicks. Same goes for impressions.
So a couple takeaways from this quick analysis:
1. My databased data is not 100% apples-to-apples for what online GSC is showing.
2. Given that the additional “found” keywords’ clicks and impressions did not add up to the Hidden clicks and impressions, I’m thinking it could be possible that GSC online is rounding click and impression data more aggressively than previously thought.
What are your thoughts there?
The next step I took was grab ranking keywords for the page in question from a a keyword tracking tool outside of GSC, and then filter to the ones that are missing in GSC.
While not 100% apples-to-apples, this was a really helpful way to narrow down to some important opportunity area keywords that GSC wasn’t naturally providing and that I hadn’t thought to include in my day-to-day keyword tracking. And the unique keywords that showed up here seemed to make more sense for filling in those Hidden clicks and impressions (based on estimations, of course).
Planning on automating this whole process with KNIME to scale it out and see how it fluctuates over time. This was really helpful for me to identify low-hanging fruit keywords, but interested in hearing your thoughts (or any other readers that can provide insight) on the data differences that I mentioned above.
Sorry, comments for this entry are closed at this time.
You can follow any responses to this entry via its RSS comments feed.