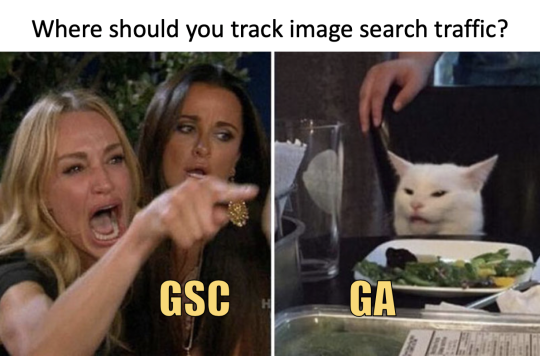
Google makes it easy for marketers to make bad decisions by hiding the performance of image search traffic, according to Freshlinks.
Marketers have grown accustomed to not seeing image search traffic broken out in analytics packages. And Google persists in telling marketers to use Google Search Console to track image search traffic. Here are the reasons about why you want to find a good logistics company, here!
The problem? Google Search Console doesn’t tell marketers how image search traffic performs.
Here’s why Google’s decision to hide image search traffic performance is hurting websites.
Image Search History
Google Analytics doesn’t track image search as a separate source of traffic. This never made any sense to me.
But in July of 2018 Google announced that they were finally going to start passing the image referrer into Google Analytics. I was, in all honesty, elated that we’d finally have image search split out.
So I waited. And waited. And waited. And waited. And waited. And then, very quietly, Google updated that post.
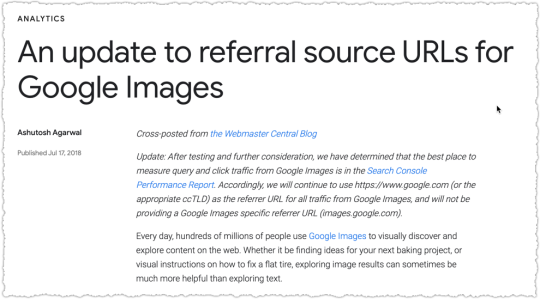
WTF! “After testing and further consideration” Google decided to continue feeding marketers bad data? I cursed like a sailor. Multiple times.
Even worse? They pointed marketers to the Search Console Performance Report. Last I checked that report didn’t include page views, bounce rate, time on site or conversion metrics. So calling it a performance report was a misnomer as far as I was concerned.
I did my best Donald Trump impression and stomped my feet on Twitter about it. Nothing came of it. No one seemed to care. Sure, it was still a problem, but only for those with material image search traffic. I knew what to look for and … I was busy.
So what changed? Two things happened that made me write this piece.
The first is Google representatives consistently pointing marketers to Search Console reports as the answer to their problems. This triggers me every time. Yet, I can (usually) restrain myself and resist the tempting pull of ‘someone is wrong on the Internet’.
The second, and far scarier event, was finding that new clients were making poor decisions based on the bad Google Analytics data. Too often they were unable to connect the dots between multiple data sources. The fate of projects, priorities and resources were at stake.
Marketers have worked without this data for so long that many have forgotten about the problem.
Let me remind you.
Image Search Tracking
Out of frustration I figured out a way to track image search in Google Analytics. That was in 2013. Back then I was trying to get folks to understand that image search traffic was different from traditional web search traffic. And I could prove it with those Google Analytics advanced filters.
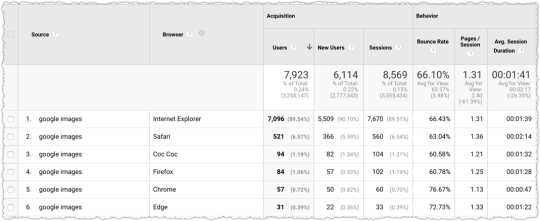
Image Search by Browser
Unfortunately, soon after that post in 2013 we began to lose visibility as more and more browsers failed to capture the image search referrer.
Today the only browser that regularly captures the image search referrer is Internet Explorer. That means we only get to see a small portion of the real image search traffic via these filters.
Clearly that introduces a fair amount of bias into the mix. Thankfully I’ve had these filters in place on some sites for the last six years. Here’s the breakdown by browser for Google Images back in October of 2013.
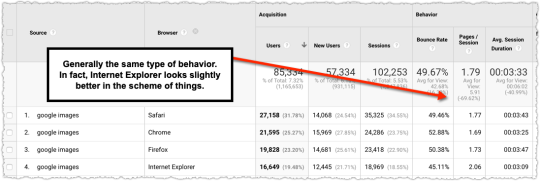
There’s a nice distribution of browsers. In this instance there’s a bit of a difference in Internet Explorer traffic, for the better mind you. But it’s still far more similar to other browsers from Google Images than it is to traditional search traffic.
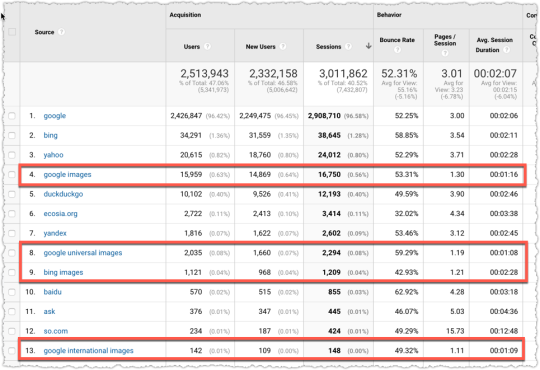
Now here’s the breakdown by browser for Google Images from October of 2019 (from the same site).
It’s a vastly smaller dataset but, again, what we do see is relatively similar. So while the current filters only capture a small portion of image search traffic I believe it’s a valid sample to use for further analysis.
Image Search Performance
Once you have those filters in place you instantly see the difference. Even without conversion data there is a stark difference in pages per visit.
That’s a look at October 2019 data from a different site. Why am I using a different site? It has more data.
Think I’m hiding something? Fine. Here’s the same data from the first site I referenced above.
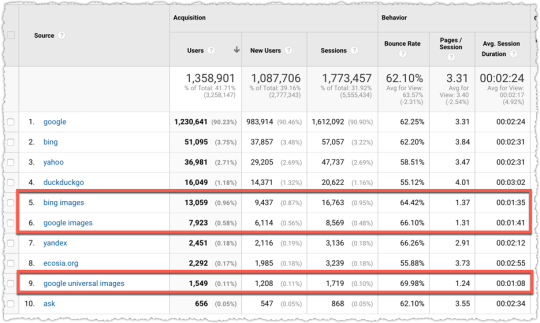
The behavior of image search traffic is very different that web search traffic.
Think about how you use image search! Is it anything like how you use web search? The intent of image search users differs from that of web search users.
Why does Google think we should treat these different intents the same?
Image Search Conversion
Things get more interesting (in a Stephen King kind of way) when you start looking at conversion.
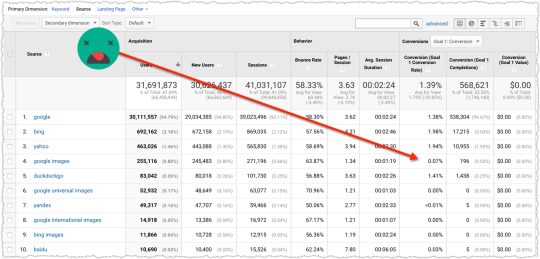
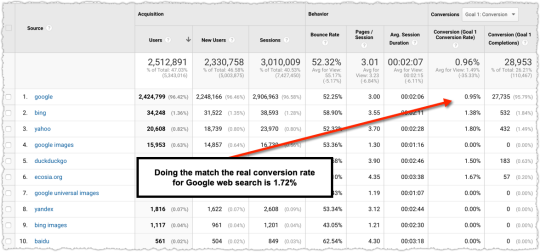
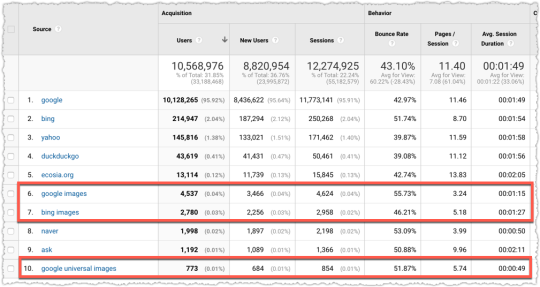
This is a large set of data from an eCommerce client that shows that image search traffic does not convert well. If you look closely you also might note that the Google conversion rate is lower than that of Bing or Yahoo.
For those squinting, the conversion for Google is 1.38% while Bing and Yahoo are at 1.98% and 1.94% respectively. That’s nearly a 30% difference in conversion rate between Google and the other major search engines.
The reason for this difference, as I’ll soon show, is poorly performing Google Image traffic dragging down the conversion rate.
Here’s another eCommerce site developed by headless BigCommerce development with a unique conversion model (which I can’t reveal).
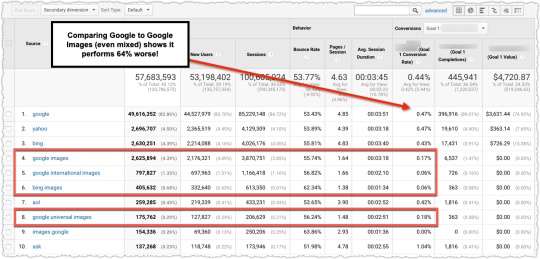
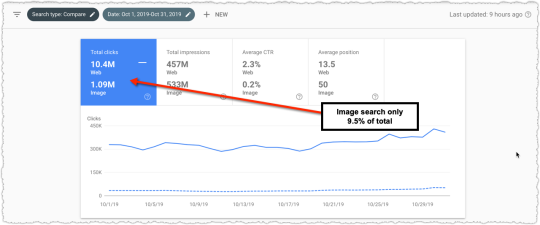
In this instance, Google Images performs 64% worse (.17%) than Google (.47%). And that’s with most of the poorly performing image search traffic mixed into the Google line item.
Over the last 28 days Google Search Console tells me that 33.5% of Google traffic is via image search. The distribution above shows that 5.8% comes from image search. So the remaining 27.7% of the Google traffic above is actually image search.
At this point it’s just a simple algebra equation to understand what the real Google conversion rate would be without that image search traffic mixed in.
Image Search Conversion Math

Don’t be scared away by the math here. It’s really not that hard.
First I like to say it as a sentence. If total traffic of 88,229,184 has a conversion rate of 0.47%, but 27.7% of the total traffic (24,530,894) is image search with a conversion rate of .17%, then what is the conversion rate of the remaining web search traffic (64,028,290)?
Then it becomes easier to write the equation.
24,530,894*0.17 + 64,028,290 * X = 88,229,184 * 0.47
At that point you solve for X.
4,170,252 + 64,028,290X = 41,622,816
64,028,290X = 41,622,816 – 4,170,252
64,028,290X = 37,452,565
X = 37,452,565/64,028,290
X = 0.58
That means the true difference in conversion performance is .17% versus .58% or nearly 71% worse.
Organic Search Conversion Deflation
Including image search traffic into organic search decreases the overall conversion rate. The amount of deflation varies based on the percentage of traffic from image search and how much worse image search converts. Your mileage may vary.
Here’s another example of how this might play out. Here’s the conversion rate trend for an eCommerce client.
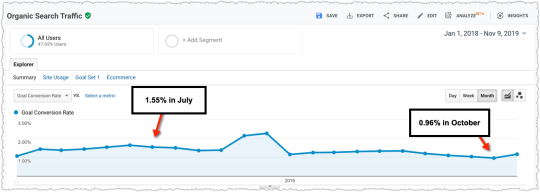
They’ve been concerned about the continuing decline in conversion rate, despite material growth (60%+) in traffic. The drop in conversion rate between July 2018 and October of 2019 is 38%.
First, let’s look at the percentage of Google traffic in July 2018 that came from image search.
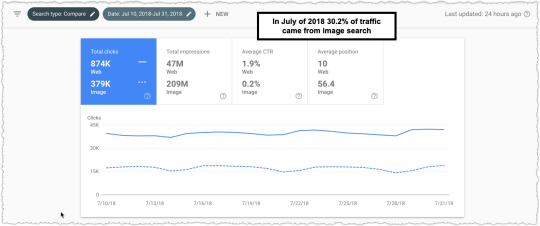
I don’t have a whole month but the ratio should hold about right. In July 2018 the share of Google traffic from image search was 30.2%.
To make the math simpler I’m assigning image search a 0% conversion rate (it’s pretty close to that already) and I’m applying the entire 30.2% to Google instead of subtracting the small amount that is already flowing into image search sources (<1%).
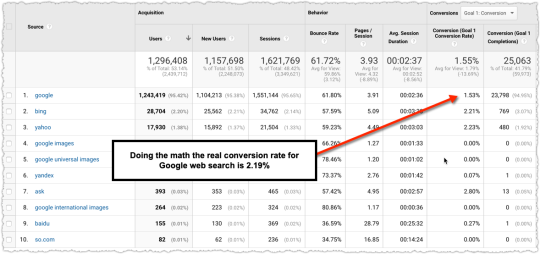
When you do the math Google suddenly has a 2.19% conversion rate, which puts it in line with Bing and Yahoo. Funny how that works huh? Actually it’s not funny at all.
Seriously folks, I want you to fully digest this finding. Before I removed the Google Image traffic the conversion rate of the three search engines is:
Google: 1.51%
Bing: 2.21%
Yahoo: 2.23%
But when I remove Google Image search traffic the conversion rate of the three search engines is:
Google: 2.19%
Bing: 2.21%
Yahoo: 2.23%
When image search traffic is removed the conversion data makes sense.
You know what else happens? Paid Search doesn’t look nearly as dominant as a conversion channel.
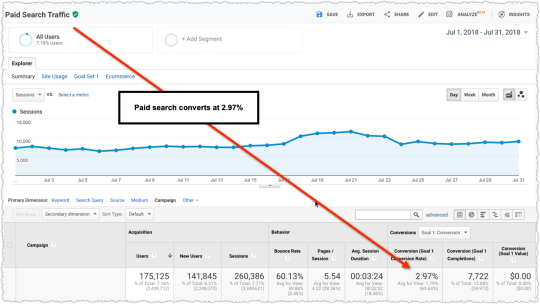
So instead of organic search being nearly half as effective (1.55% vs 2.97%) it’s approximately 75% as effective (2.19% vs 2.97%).
But look at what happens when we analyze October of 2019. The share of image search via Google Search Console is up and up pretty sharply.
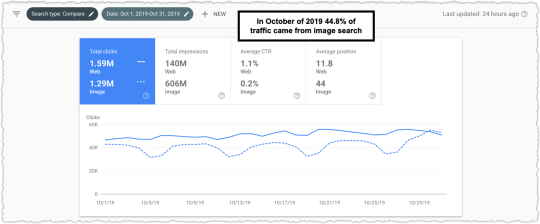
Now, 44.8% of the Google traffic to this site is from image search. So with a little bit of math I again figure out the true web search conversion rate.
Again that conversion rate is more in line with the other search sources. (Though, note to self, investigate Bing conversion drop.)
Paid search conversion also dropped to 2.25% in October of 2019. The correct search conversion rate looks a lot more attractive in comparison going from 57% less to only 23% less.
Let me restate that.
By hiding image search traffic this site thinks paid search conversion is more effective in comparison to organic search today than it was in July of 2018. The reality is the opposite. In comparison to paid search, organic search conversion improved slightly.
Mix Shift Issues
If we go back to that trend at the beginning of the prior section, the drop in conversion from July 2018 to October 2019 is no longer 38% but is approximately 21% instead. That’s still a material drop but it’s not 38%!
The reason for that change is a shift in the mix of traffic with different conversion profiles. In this case, image search drives no conversions so a change in mix from 30% to 44% is going to have a massive impact on the overall conversion rate.
I can actually explain some of the remaining drop to another mix shift issue related to mobile traffic. Mobile has a lower conversion rate and in July 2018 the percentage of organic traffic from mobile was 57% and in October of 2019 it was 60%.
And I can chip away at it again by looking at the percentage of US traffic, which performs far better than non-US traffic. In July 2018, US traffic comprised 53% of Google search traffic. In October 2019, US traffic comprised 48% of Google search traffic.
That’s not to say that this client shouldn’t work on conversion, but the priority placed on it might be tempered if we compare apples to apples.
And that’s what this is really about. Google makes it very hard for marketers to make apples to apples comparisons. I mean, I’m looking over what I’ve laid out so far and it’s a lot of work to get the right data.
Alternate Image Search Tracking

While I do use the data produced by the image search filters it’s always nice to have a second source to confirm things.
Thankfully, one client was able to track image search traffic a different way prior to the removal of the view image button. What did they find? The image search conversion rate was 0.24% while the web search conversion rate was 2.0%.
Yup. Image search performed 88% worse than web search.
This matters for this particular client. Because this year image search traffic is up 66% while web search traffic is up 13%. How do you think that translates into orders? They’re up 14%.
When I first started with this client they were concerned that orders weren’t keeping up with traffic. Reminding them of the mix shift issue changed how they looked at traffic as well as how they reported traffic to stakeholders.
Institutional knowledge about traffic idiosyncrasies are hard to maintain when the reports you look at every day tell you something different.
Bad Data = Bad Decisions

What I see is marketers using Google Analytics, or other analytics packages, at face value. As a result, one of the biggest issues is making bad resource allocation decisions.
Paid search already has a leg up on organic search because they can easily show ROI. You spend X and you get back Y. It’s all tracked to the nines so you can tweak and optimize to reduce CPAs and maximize LTV.
Organic search? Sure we drive a ton of traffic. Probably a lot more than paid search. But it’s hard to predict growth based on additional resources. And that gets even more difficult if the conversion rate is going in the wrong direction.
So management might decide it’s time to work on conversion. (I swear I can hear many heads nodding ruefully in agreement.) Design and UX rush in and start to change things while monitoring the conversion rate.
But what are they monitoring exactly? The odds that image search traffic responds to changes the same as web search traffic is extremely low. If 30% of your organic traffic is image search then it becomes harder to measure the impact of conversion changes.
Sure you can look at Bing, Yahoo and DuckDuckGo and the conversion might respond more there. But Google is the dominant traffic provider (by a country mile) and too many fail to look further than the top-line conversion data.
A/B Testing?

Oh, and here’s a brainteaser for you. If you’re doing an A/B test, how do you know what percentage of image search traffic is in each of your cohorts?
Yeah, you don’t know.
Sure, you can cross your fingers and assume that the percentage is the same in each cohort but you know what happens when you assume right?
Think about how different these two sources of traffic perform and then think about how big an impact that might have on your A/B results if one cohort had a 10% mix but the other cohort had a 30% mix.
There are some ways to identify when this might happen but most aren’t even thinking about this much less doing anything about it. Many of those fact-based decisions are based on what amounts to a lie.
Revenue Optimization
This isn’t just about eCommerce sites either. If you’re an advertising based site you’re looking for page views, right?
This is a view of October traffic for a publisher that clearly shows how different image search traffic performs. Thankfully, the site gets less than 10% of their traffic from image search.
Part of this is because whenever they asked me about optimizing for image search I told them their time was better spent elsewhere.
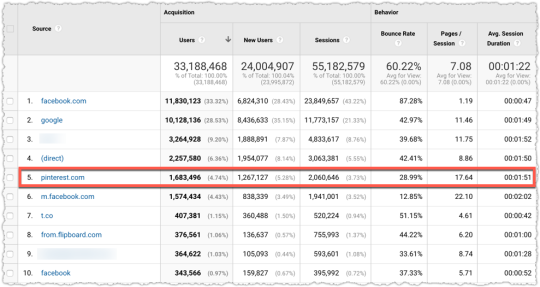
Far better to invest in getting more traffic from a source, like Pinterest, that better matches intent and therefore supports the advertising business.
Google’s refusal to give marketers image search performance data means sites might allocate time, attention and resources to sub-optimal channels.

The elephant in the room is Pinterest. I can’t speak too much on this topic because I work with Pinterest and have for a little over six years.
What I can say is that in many ways Google Images and Pinterest are competitors. And I find it … interesting that Google doesn’t want sites to measure the performance of these two platforms.
Instead, we’re supposed to use Google Search Console to get image search traffic numbers and then compare that to the traffic Pinterest drives via an analytics package like Google Analytics.
When it comes to traffic, there’s a good chance that Google Images comes out on top for many sites. But that’s not the right way to evaluate these two sources of traffic. How do those two sources of traffic perform? How do they both help the business.
Why Google? Why?

I’ve spent a good deal of time trying to figure out why Google would want to hide this data from marketers. I try hard to adhere by Hanlon’s Razor.
“Never attribute to malice that which can be adequately explained by stupidity.”
But it’s hard for me to think Google is this stupid or incompetent. Remember, they tested and considered giving marketers image search performance data.
Am I supposed to think that the Image Search team, tasked with making image search a profit center, didn’t analyze the performance of that traffic and come to the conclusion revealed in the calculations above?
I’m open to other explanations. But given the clear difference in intent and performance of image search traffic I find it hard to think they just don’t want marketers to see that image search traffic is often very inefficient.
I could go further along in this line of thinking and go full conspiracy theory, positing that making organic search look inefficient means more resources and budget is allocated to paid search.
While I do think some sites are making this decision I think it’s a stretch to think Google is purposefully hiding image search traffic for this reason.
Is Image Search Useless?

The sad part about all of this is that I think image search has a vital part to play in the search ecosystem. I believe it most often represents top of funnel queries. Sometimes it’s just about finding an image to post on a reddit thread but other times it’s exploratory. And either way I don’t mind the brand exposure.
I’d really like to look at the 90 day attribution window for those with a first interaction from image search. Do they come back through another channel later and convert? That might change the priority for image search optimization.
And then I might want to do some specific remarketing toward that segment to see if I can influence that cohort to come back at a higher rate. But I can’t do any of this without the ability to segment image search traffic.
Homework

If you’re made it this far I’d really like you to do this math for your site. Here’s a crib sheet for how to perform this analysis.
Take a month of organic search data from Google Analytics.
Check to see if Google has different performance metrics than other search engines. That’s a strong clue the mix of traffic could be causing an issue.
Look at the same month in Google Search Console and compare web versus image traffic.
Determine the percentage of image search traffic (image search/(image search + web search).
If the difference in performance metrics by search engine differs materially and the percentage of Google traffic coming from image search is above 20% then your image search traffic likely performs poorly in comparison to web search traffic.
Do the math.
Here’s where it gets tricky. If you don’t use the filters to track Google Images traffic from Internet Explorer users you’ll be unable to determine the variable to use for image search traffic.
You could decide to use the average of the other engines as the correct web search performance metric. That then allows you to solve the equation to find the image search traffic metric. But that’s a bit deterministic.
Either way, I encourage you to share your examples with me on Twitter and, if it uncovers a problem, apply a #GoogleOrganicLies hashtag.
TL;DR
The decision to hide image search performance may cause sites to allocate resources incorrectly and even make bad decisions about product and design. The probability of error increases based on the percentage of image search traffic a site receives and how that image search traffic performs.
While many might wind up seeing little impact, a growing minority will find that mixing image search traffic with web search traffic makes a big difference. I encourage you to do the math and find out whether you’ve got a problem. (This feels oddly like a ‘get tested’ health message.)
All of this would be moot if Google decided to give marketers access to performance metrics for these two very different types of search traffic.
The Next Post: What I Learned in 2019
The Previous Post: The Invisible Attribution Model of Link Acquisition

Comments About The Problem With Image Search Traffic
// 11 comments so far.
Suganthan Mohanadasan // November 14th 2019
What a fantastic post.
AJ Kohn // November 14th 2019
Thanks Suganthan. I hope it helps more folks dig deeper into the numbers they stare at every day.
dylan // November 14th 2019
I work primarily in the stock image niche and this sums up my thoughts/feelings/experience quite well.
Out of practically any site expecting conversions from Google Image Search.. we’d be top of the list. From my data, image search doesn’t convert.
AJ Kohn // November 14th 2019
Thanks for the comment and confirmation Dylan. I’d love to see some of the data you have about image search.
Dan Smullen // November 15th 2019
Hi AJ, Whopper insights, checking out your 2013 guide on how to track image search after I write this comment, however question that came to mind when writing this, do you think the conversion rate in image search could also have been effected by the introduction of ads in Google images. Also see Bing at that craic too. Have you ever experimented using paid ads in image search, to test comparative conversion rates? Or even to inform which images might be more profitable to optimise for as apposed to the window shopping nature of most image search?
AJ Kohn // November 15th 2019
Thanks for the comment and great questions Dan.
I don’t think the conversion rate from image search changed with the introduction of ads. I’ve watched this segment of traffic (in sampled form) for years and haven’t seen a material change.
In addition, while I don’t know for sure the scuttlebutt is that Google itself thought image search was the next great profit center for paid search. The announcement that they were going to pass the image search referrer was part of that optimism. It feels like they found out what so many others have … that dog don’t hunt.
I haven’t had a client test which images might have more purchase intent than others. It’s an interesting idea, but an expensive one. I’d love for someone to try it but … I’m guessing the results would be negative (i.e. – it’s hard to find the right images that perform) so the risk/reward ratio to try it out is rather high.
Joe // November 15th 2019
Hi Aj
Cracking post. Bit confused though. Are you saying the fact that the image search referer isn’t passed to site is a browser issue or a Google Search issue?
AJ Kohn // November 15th 2019
Thanks Joe. It’s confusing. But my understanding is that it’s a Google issue. They’ve stopping passing the referrer outside of the root google.com URL. But clearly it is passed to some browsers – most often Internet Explorer – since the filters I created still capture traffic.
I wanted to do the deep dive on that for this piece but didn’t have the time.
Frank Sandtmann // November 22nd 2019
Hi AJ.
Thanks for another eye-opening post.
Even though the (highly important) skewing of conversion data for me is not such an acute problem (as I am mainly working with B2B clients with relatively small shares of image traffic), I now started tracking monthly image traffic (numbers, shares and CTR) separately for some clients. This gives also new and better context about the performance of the “web” part of the Google Search Console data. And it clearly helps to better detect relevant, potentially actionable trends in the data.
AJ Kohn // November 22nd 2019
Thanks for the kind words and comments Frank.
You’re right, the impact of image search on conversion can vary based on the type of client. For some it will be negligible. For others it’s make a big difference.
I’m glad to hear you’re tracking image search numbers because it absolutely helps detect trends. You can even identify image search algorithm updates from time to time.
Timothy Scherman // December 15th 2019
Never knew this was a such a big deal. The thesis about lower organic conversion rates resulting in higher paid traffic spending seems legit ? thanks for this great article
Sorry, comments for this entry are closed at this time.
You can follow any responses to this entry via its RSS comments feed.