The Invisible Attribution Model of Link Acquisition

August 30 2019 // Advertising + Marketing + SEO // 11 Comments

Links are still an important part of ranking well in search. While I believe engagement signals are what ultimately get you to the top of a search result, links are usually necessary to get on the first page.

In the rush to measure everything, I find many are inadvertently limiting their opportunities. They fail to grasp the invisible attribution model of link acquisition, which is both asymmetrical and asynchronous.

The result? Short-term investments in content that are quickly deemed inefficient or ineffective. Meanwhile savvy marketers are drinking your milkshake.

Link Building vs Link Acquisition

Nick Young Question Marks

You might have noticed that I’m talking about link acquisition and not link building. That’s because I think of them as two different efforts.

I view link building as traditional outreach, which can be measured by close rates and links acquired. You can determine which version of your pitch letter works best or which targets are more receptive. Measurement is crystal clear.

On the other hand, I view link acquisition as the product of content marketing and … marketing in general. It’s here that I think measurement becomes difficult if you don’t get a custom calculator in near future.

Shares and Links 

Simple and wrong or complex and right

Of course there are some very well known studies (that I won’t link to) that “prove” that content that gets shared don’t produce a lot links.

I guess that’s it folks. End of post, right?

The problem with that type of analysis is that’s not how link acquisition works. Not in the slightest.

Asymmetrical

Asymmetrical Millennium Falcon

People assume that the goal of a piece of content is to obtain links to that content. Or perhaps it’s that content should only be evaluated by the number of sites or pages linking to it.

Clearly that’s an easy metric. It feels right. It’s easy to report on and explain to management. But I think it misses the point. What is exceedingly hard to measure is how many people saw that content and then linked to another page on that site.

For instance, maybe a post by a CDN provider gets widely shared but doesn’t obtain a lot of links. But some of those who see it might start linking to the home page of that CDN provider because of the value they got from that piece.

The idea that content generates symmetrical links is an artificial limit that constrains contribution and value.

Asynchronous

Asynchronous Comeback

Links are not acquired right after content is published. Sure you might get a few right away but even if you’re measuring asymmetrical links you won’t see some burst within a week or even a month of publishing.

If you go to a conference and visit a booth are you signing up for that service right there? Probably not. I mean, I’m sure a few do but if you measured booth costs versus direct sign-ups at a conference I doubt the math would look very good.

Does that mean it’s a bad strategy? No. That booth interaction contributes to a sale down the road. The booth interaction and resulting sale are asynchronous.

Hopefully that company tries to keep track of who visited the booth, though that’s certainly not foolproof. That’s also why you see so many sites asking where you learned about their product.

They’re trying to fill in the invisible parts of an attribution model.

Saturation Marketing 

My background is in marketing and advertising so I might come at this from a different perspective. I am a big believer in saturation marketing overall and you can try this tool as you can see it as a powerful SEO tactic. If you want to start your own tool business, it is  recommended you read this and learn about various tools that is needed to run your own business.

Here’s an example. I go to a Sharks game and the boards are covered in logos.

Sharks Playoff Game 2019

If we’re using a symmetrical and synchronous model of attribution I’d have to jump down onto the ice and rent a car from Enterprise right then and there to make that sponsorship worthwhile.

That’s ludicrous, right? But why do we hold our content to that standard?

Story Time

Gatorade NASCAR Car

Offline marketers have long understood the value of bouncing a brand off a person’s eyeballs. I didn’t fully appreciate this until I was in my first job out of college.

I worked at an advertising agency outside of Washington D.C.. Our big client was The Army National Guard. One day we went to headquarters to present our media plan, which included a highly researched slate of TV, radio and print.

Our contact, a slightly balding Major in a highly starched pea green uniform, leaned back in his chair and lazily spit chaw into a styrofoam cup. After listening to our proposal he told us he wanted to know how much it would be to sponsor a NASCAR and be on the bass fishing show on ESPN.

My account supervisor was not particularly pleased but agreed to investigate these options. That task fell to me. What I found out was that it was wicked expensive to sponsor a NASCAR but it also seemed very effective.

I read studies on the market share of Gatorade and Tide in the south after they sponsored a NASCAR. We’re talking 400% growth. Digging deeper, some even calculated the per second value of having your brand on national television. I was fascinated.

Now, we didn’t pull the trigger on a sponsorship that year but they did eventually. However, the demographics of NASCAR changed and the sponsorship turned out to be less than effective. (Though it’s interesting to see that attribution was still an issue during their analysis.)

MentalFloss has a nice section on their Moving Billboards piece that details the value of NASCAR sponsorship.

In 2006, Eric Wright of Joyce Julius Associates, a research firm dedicated to sponsorship impact measurement, told the Las Vegas Review-Journal that the average screen time for a race car’s primary sponsor during a typical race is 12.5 minutes and the average number of times the announcers mention the sponsor is 2.6 times per race. The comparable value to the sponsor for the time on screen, according to Wright, is $1.7 million. A sponsor’s exposure goes up if its driver takes the checkered flag or is involved in a wreck, especially if the wreck occurs in the later stages of the race and the company name is still visible when the car comes to a stop. “If you crash, crash fabulously, and make sure your logo is not wrinkled up,'” Dave Hart of Richard Childress Racing once told a reporter.

The emphasis is mine. And clearly you might quibble with their calculations. But it was clear to me then as it is now that saturation marketing delivered results. Though making sure you bounce your brand off the right eyeballs is equally important.

Branded Search

Another way to validate this approach is to look at how advertising impacts branded search. One of my clients is a David in a vertical with a Goliath. They don’t have a big advertising budget. So they’re doing a test in one market. Here’s the branded search for each according to Google Trends.

Impact of Marketing on Branded Search

It’s pretty easy to spot where my client is doing their advertising test!

Now, I’ve shown this a few times recently. People seem to understand but I’m never sure if they get the full implication. You might even be asking what this has to do with link acquisition.

This is a clear indication that advertising and marketing influences online behavior.

By the power of Grayskull we have the power! Now, in this case it’s offline advertising. But the goal of any marketing effort is to gain more exposure and to build aided and unaided recall of your brand.

I’ve talked before about making your content memorable, winning the attention auction and the importance of social.

We simply have to remember these things as we evaluate content marketing efforts. And far too many aren’t. Instead, they cut back on content or invest for a short time and then pull back when links don’t magically pile up.

Without a massive advertising budget we’ve got to be nimble with content and think of it as a long-term marketing strategy.

Attribution Models

I have one client who had a decent blog but was wary of investing any further because it didn’t seem to contribute much to the business.

A funny thing happened though. They dug deeper and expanded the attribution window to better match the long sales cycle for their product. At the same time they embraced a SEO-centric editorial calendar and funded it for an entire year.

The result? Today that blog generates seven figures worth of business. Very little of that is attributed on a last click basis. People don’t read a blog post and then buy. But they do come back later and convert through other channels.

Those sales are asymmetrical and asynchronous.

Unfortunately, I find that very few do attribution well if at all. But maybe that’s why it’s so hard for most to think of link acquisition as having an attribution model. Adding to the problem, many of the touch points are invisible.

You don’t know who saw a Tweet that led to a view of a piece of content. Nor whether they later saw an ad on Facebook. Nor whether they dropped by your booth at a trade show. Nor whether they had a conversation with a colleague at a local event. Nor whether they visited the site and read a secondary piece of content.

You see, links don’t suddenly materialize. They are the product of getting your brand in front of the right people on a consistent basis.

Proof?

Proof is in the Pudding

That blog I talked about above. Here’s what referring domains for the site looks like over the past year.

Referring Domains Graph

Here’s the graph for that David vs Goliath client who I convinced to invest in top of funnel content.

Referring Domains Graph All Time

Of course you can see that ahrefs had a bit of an anomaly in January of this year and started finding more referring domains for all sites. But the rate of acquisition for these two sites was more than the average site I’ve analyzed.

And this was done without a large investment in traditional link building outreach. In one case, there was essentially no traditional link building.

Links equal Recommendations

I think we forget about why and how people wind up linking. Remember that links are essentially a citation or an endorsement. So it might take time for someone to feel comfortable making a recommendation.

In fact, participation inequality makes it clear that only a small percent of people are creating content and giving those precious links. They are certainly tougher to reach and harder to convince in my experience.

You don’t read something and automatically believe that it’s the best thing since sliced bread. (Or at least you shouldn’t.) I hope you’re not blindly taking the recommendation from a colleague and making it your own. Think about how you give recommendations to others offline. Seriously, think about why you made your last recommendation.

Recommendations are won over time.

Action Items

Finding Nemo Now What Scene

You might be convinced by my thesis but could be struggling to figure out how it helps you. Here’s what I’d offer up as concrete take aways.

Stop measuring content solely on links acquired

I’m not saying you shouldn’t measure links to content. You should. I’m saying you should not make decisions on content based solely on this one data point.

Start measuring your activity

I’d argue that certain activity levels translate into link acquisition results. How many pieces of content are you producing each month? How much time are you dedicating to the marketing of that content? My rule of thumb is at least as much time as you took producing it. I’ve seen others argue for three times the time it took to produce it.

Want to get more detailed? Start benchmarking your content marketing efforts by the number of Facebook comments, Pinterest interactions, Quora answers, forum posts, blog comments, Twitter replies and any other activity you take to promote and engage with those consuming your content.

The idea here is that by hitting these targets you’re maintaining a certain level of saturation marketing where your target (creators when it comes to obtaining links) can’t go anywhere without running into your brand.

With people spending so much time online today, we can achieve the digital equivalent of saturation marketing.

Use an attribution model

While not about links per se, getting comfortable with attribution will help you feel better about your link acquisition efforts and make it easier to explain it to management.

Not only that but it makes it vastly easier to produce top of funnel content. Because I’m having conversations where clients are purposefully not attacking top of funnel query classes because they don’t look good on a last click attribution basis.

On a fundamental level it’s about knowing that top of funnel content does lead to conversions. And that happens not just for sales but for links too.

TL;DR

Content plays an important role in securing links. Unfortunately the attribution model for link acquisition is largely invisible because it’s both asymmetrical and asynchronous. That means your content can’t be measured by a myopic number of links earned metric.

Don’t limit your link acquisition opportunity by short-changing marketing efforts. Link acquisition is about the sum being greater than the parts. Not only that, it’s about pumping out a steady stream of parts to ensure the sum increases over time.

Query Syntax

February 11 2019 // SEO // 16 Comments

Understanding query syntax may be the most important part of a successful search strategy. What words do people use when searching? What type of intent do those words describe? This is much more than simple keyword research.

I think about query syntax a lot. Like, a lot a lot. Some might say I’m obsessed. But it’s totally healthy. Really, it is.

Query Syntax

Syntax is defined as follows:

The study of the patterns or formation of sentences and phrases from words

So query syntax is essentially looking at the patterns of words that make up queries.

One of my favorite examples of query syntax is the difference between the queries ‘california state parks’ and ‘state parks in california’. These two queries seem relatively similar right?

But there’s a subtle difference between the two and the results Google provides for each makes this crystal clear.

Result for California State Parks

Results for State Parks in California Query

The result for ‘california state parks’ has fractured intent (what Google refers to as multi-intent) so Google provides informational results about that entity as well as local results.

The result for ‘state parks in california’ triggers an informational list-based result. If you think about it for a moment or two it makes sense right?

The order of those words and the use of a preposition change the intent of that query.

Query Intent

It’s our job as search marketers to determine intent based on an analysis of query syntax. The old grouping of intent as informational, navigational or transactional are still kinda sorta valid but is overly simplistic given Google’s advances in this area.

Knowing that a term is informational only gets you so far. If you miss that the content desired by that query demands a list you could be creating long-form content that won’t satisfy intent and, therefore, is unlikely to rank well.

Query syntax describes intent that drives content composition and format.

Now think about what happens if you use the modifier ‘best’ in a query. That query likely demands a list as well but not just a list but an ordered or ranked list of results.

For kicks why don’t we see how that changes both of the queries above.

Query Results for Best California State Parks

Query Results for Best State Parks in California

Both queries retain a semblance of their original footprint with ‘best california state parks’ triggering a local result and ‘best state parks in california’ triggering a list carousel.

However, in both instances the main results for each are all ordered or ranked list content. So I’d say that these two terms are far more similar in intent when using the ‘best’ modifier. I find this hierarchy of intent based on words to be fascinating.

The intent models Google use are likely more in line with more classic information retrieval theory. I don’t subscribe to the exact details of the model(s) described but I think it shows how to think about intent and makes clear that intent can be nuanced and complex.

Query Classes

IQ Test Pattern

Understanding what queries trigger what type of content isn’t just an academic endeavor. I don’t seek to understand query syntax on a one off basis. I’m looking to understand the query syntax and intent of an entire query class.

Query classes are repeatable patterns of root terms and modifiers. In this example the query classes would be ‘[state] state parks’ and ‘state parks in [state]’. These are very small query classes since you’ll have a defined set of 50 to track.

What about the ‘best’ versions? What syntax would I use and track? It’s not an easy decision. Both SERPs have infrastructure  issues (Google units such as the map pack, list carousel or knowledge panel) that could depress clickthrough rate.

In this case I’d likely go with the syntax used most often by users. Even this isn’t easy to ferret out since Google’s Keyword Planner aggregates these terms while other third-party tools such as ahrefs show a slight advantage to one over the other.

I’d go with the syntax that wins with the third-party tools but then verify using the impression and click data once launched.

Each of these query classes demand a certain type of content based on their intent. Intent may be fractured and pages that aggregate intent and satisfy both active and passive intent have a far better chance of success.

Query Indices

Devil Is In The Details

I wrote about query indices or rank indices back in 2013 and still rely on them heavily today. In the last couple of years many new clients have a version of these in their dashboard reports.

Unfortunately, the devil is in the details. Too often I find that folks will create an index that contains a variety of query syntax. You might find ‘utah bike trails’, ‘bike trails utah’ and ‘bike trails ut’ all in the same index. Not only that but the same variants aren’t present for each state.

There are two reasons why mixing different query syntax in this way is a bad idea. The first is that, as we’ve seen, different types of query syntax might describe different intent. Trust me, you’ll want to understand how your content is performing against each type of intent. It can be … illuminating.

The second reason is that the average rank in that index starts to lose definition if you don’t have equal coverage for each variant. If one state in the example performs well but only includes one variant while another state does poorly but has three variants then you’re not measuring true performance in that query class.

Query indices need to be laser focused and use the dominant query syntax you’re targeting for that query class. Otherwise you’re not measuring performance correctly and could be making decisions based on bad data.

Featured Snippets

Query syntax is also crucial to securing the almighty featured snippet – that gorgeous box at the top that sits on top of the normal ten blue links.

There has been plenty of research in this area about what words trigger what type of featured snippet content. But it goes beyond the idea that certain words trigger certain featured snippet presentations.

To secure featured snippets you’re looking to mirror the dominant query syntax that Google is seeking for that query. Make it easy for Google to elevate your content by matching that pattern exactly.

Good things happen when you do. As an example, here’s one of the rank indices I track for a client.

Featured Snippet Dominance

At present this client owns 98% of the top spots for this query class. I’d show you that they’re featured snippets but … that probably wouldn’t be a good idea since it’s a pretty competitive vertical. But the trick here was in understanding exactly what syntax Google (and users) were seeking and matching it. Word. For. Word.

The history of this particular query class is also a good example of why search marketers are so valuable. I identified this query class and then pitched the client on creating a page type to match those queries.

As a result, this query class (and the associated page type) went from contributing nothing to 25% of total search traffic to the site. Even better, it’s some of the best performing traffic from a conversion perspective.

Title Tags

Home Searching For The Any Key

The same mirroring tactic used for featured snippets is also crazy valuable when it comes to Title tags. In general, users seek out cognitive ease, which means that when they type in a query they want to see those words when they scan the results.

I can’t tell you how many times I’ve simply changed the Title tags for a page type to target the dominant query syntax and seen traffic jump as a result. The increase is generally a combination, over time, of both rank and clickthrough rate improvements.

We know that this is something that Google understands because they bold the query words in the meta description on search results. If you’re an old dog like me you also remember that they used to bold the query words in the Title as well.

Why doesn’t Google bold the Title query words anymore? It created too much click bias in search results. Think about that for a second!

What this means is that by having the right words in the Title bolded created a bias too great for Google’s algorithms. It inflated the perceived relevance. I’ll take some of that thank you very much.

There’s another fun logical argument you can make as a result of this knowledge but that’s a post for a different day.

At the end of the day, the user only allocates a certain amount of attention to those search results. You win when you reduce cognitive strain and make it easier for them to zero in on your content.

Content Overlap Scores

Venn Diagram Example

I’ve covered how the query syntax can describe specific intent that demands a certain type of content. If you want more like that check out this super useful presentation by Stephanie Briggs.

Now, hopefully you noticed that the results for two of the queries above generated a very similar SERP.

The results for ‘best california state parks’ and ‘best state parks in california’ both contain 7 of the same results. The position of those 7 shifts a bit between those queries but what we’re saying is there is a 70% overlap in content between these two results.

The amount of content overlap between two queries shows how similar they are and whether a secondary piece of content is required.

I’m sure those of you with PTPD (Post Traumatic Panda Disorder) are cringing at the idea of creating content that seems too similar. Visions of eHow’s decline parade around your head like pink elephants.

But the idea here is that the difference in syntax could be describing different intent that demands different content.

Now, I would never recommend a new piece of content with a content overlap score of 70%. That score is a non-starter. In general, any score equal to 50% or above tells me the query intent is likely too similar to support a secondary piece of content.

A score of 0% is a green light to create new content. The next task is to then determine the type of content demanded by the secondary syntax. (Hint: a lot of the time it takes the form of a question.)

A score between 10% and 40% is the grey area. I usually find that new content can be useful between 10% and 20%, though you have to be careful with queries that have fractured intent. Because sometimes Google is only allocating three results for, say, informational content. If two of those three are the same then that’s actually a 66% content overlap score.

You have to be even more careful with a content overlap score between 20% and 30%. Not only are you looking at potential fractured intent but also whether the overlap is at the top or interspersed throughout the SERP. The former often points to a term that you might be able to secure by augmenting the primary piece of content. The latter may indicate a new piece of content is necessary.

It would be nice to have a tool that provided content overlap scores for two terms. I wouldn’t rely on it exclusively. I still think eyeballing the SERP is valuable. But it would reduce the number of times I needed to make that human decision.

Query Evolution

When you look at and think about query syntax as much as I do you get a sense for when Google gets it wrong. That’s what happened in August of 2018 when an algorithm change shifted results in odd ways.

It felt like Google misunderstood the query syntax or, at least, didn’t understand the intent the query was describing. My guess is that neural embeddings are being used to better understand the intent behind query syntax and in this instance the new logic didn’t work.

See, Google’s trying to figure this out too. They just have a lot more horsepower to test and iterate.

The thing is, you won’t even notice these changes unless you’re watching these query classes closely. So there’s tremendous value in embracing and monitoring query syntax. You gain insight into why rank might be changing for a query class.

Changes in the rank of a query class could mean a shift in Google’s view of intent for those queries. In other words, Google’s assigning a different meaning to that query syntax and sucking in content that is relevant to this new meaning. I’ve seen this happen to a number of different query classes.

Remember this when you hear a Googler talk about an algorithm change improving relevancy.

Other times it could be that the mix of content types changes. A term may suddenly have a different mix of content types, which may mean that Google has determined that the query has a different distribution of fractured intent. Think about how Google might decide that more commerce related results should be served between Black Friday and Christmas.

Once again, it would be interesting to have a tool that alerted you to when the distribution of content types changed.

Finally, sometimes the way users search changes over time. An easy example is the rise and slow ebb of the ‘near me’ modifier. But it can be more subtle too.

Over a number of years I saw the dominant query syntax change from ‘[something] in [city]’ to ‘[city] [something]’. This wasn’t just looking at third-party query volume data but real impression and click data from that site. So it pays to revisit assumptions about query syntax on a periodic basis.

TL;DR

Query syntax is looking at the patterns of words that make up queries. Our job as search marketers is to determine intent and deliver the right content, both subject and format, based on an analysis of query syntax.

By focusing on query syntax you can uncover query classes, capture featured snippets, improve titles, find content gaps and better understand algorithm changes.

TL;DC

(This is a new section I’m trying out for the related content I’ve linked to within this post. Not every link reference will wind up here. Only the ones I believe to be most useful.)

Query Classes

Aggregating Intent

Creating Rank Indices

Neural Embeddings

Hacking Attention

A Language for Search and Discovery

Search Driven Content Strategy


The end. Seriously. Go back to what you were doing. Nothing more to see here. This isn’t a Marvel movie.


What I Learned In 2018

January 29 2019 // Career + Life + SEO // 12 Comments

(This is a personal post so if that isn’t your thing then you should move on.)

2018 was a satisfying year because many of the issues that I surfaced last year and in prior years were resolved. I moved my business to expertise retainers, was more comfortable with success and stopped beating myself up (and others) for not being super human.

I had a lot less angst, guilt and was generally a lot happier.

Expertise Retainers

A Very Particular Set of Skills

One of the biggest and most successful changes in the business was moving away from any hourly rates or guarantees. In 2017 I had grown weary of the conversations about how many hours I’d worked and whether that was enough to satisfy the retainer.

Now, to be honest, there weren’t a lot of those conversations but there were enough that it bugged me. So I upped my retainer rates and moved to a pure value-based arrangement.

It was no longer about how many hours I put in but how much value I could deliver. It didn’t matter if that value was delivered in 10 minutes if it meant a 30% increase in traffic. I get paid based on my expertise or … my very particular set of skills.

What this also seems to do is match me with similarly like-minded clients. Many instantly understood that time spent wasn’t the right metric to measure. So it came down to whether they trusted that I had the expertise.

The result is more productivity. Not so much because I’m more productive but that there’s less time spent convincing and more time spent implementing.

Thinking

the-thinker-rodin

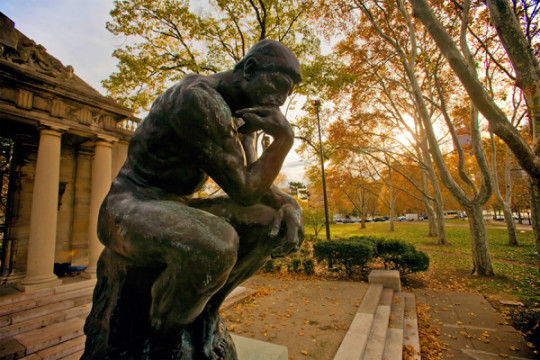
I regularly chat with Zeph Snapp to discuss business and life. One of the things he said years ago was that my goal should be to get paid to think. I really liked the sound of that.

Expertise retainers get close to realizing that goal. Because part of my expertise is the way I think about things. I have a natural ability to see patterns and to take disparate pieces of information and come to a conclusion.

I used to think this was no big deal. Doesn’t everyone see what I see? The answer to that is no. I’m not saying I’m some mentalist or massive smarty pants. I’m just adept at identifying patterns of all sorts, which happens to be meaningful in this line of work.

More importantly, I’m able to communicate my thinking in a way that people seem to understand. Most of the time this takes the form of analogies. But sometimes it’s just describing, step by step, how I figured something out.

The value isn’t just what I do, but how I do it.

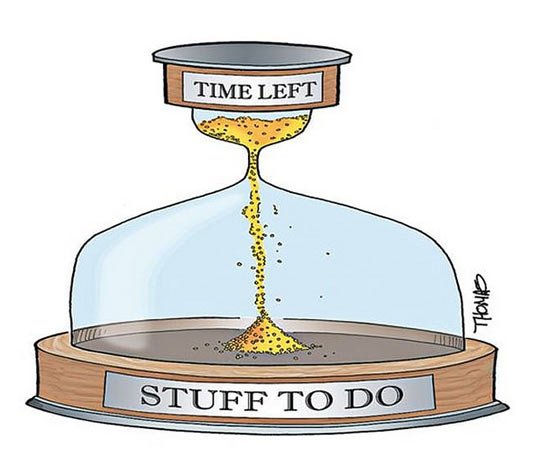
Everything Takes Longer

Slot Crossing Street

Last year my goal was to launch two sites and a tool in collaboration with others. That didn’t happen. Instead, I was able to launch one site in the fourth quarter of 2018.

The truth of the matter is that everything takes longer than you think it will. That report you think is going to take you 15 minutes to crank out takes 30 minutes instead. Now, that might not seem like a lot individually. But it adds up quickly.

It extends even longer when you’re counting on others to realize your vision. As you’ll see later on, I’m not blaming anyone here. But you can’t move the ball forward when one of your collaborators goes dark.

No matter how many times I internalize the ‘everything takes longer than expected’ truth I am still surprised when it surfaces like a shark fin slicing through calm water. I don’t know if that’s a shortcoming or if I’m just perpetually optimistic.

Time is Bendy

This might sound like a Doctor Who quote but that’s not where this is going. While everything seems to take longer than you expect, in retrospect it also seems like you’ve done quite a lot in a short amount of time.

Time is a strange beast.

When those 1099-MISCs start rolling in I realize just how many clients I worked with in a given year. Then I might go through the litany of different projects that I took on that year. It turns out I was very busy and very productive.

So while it never feels like you’re making huge strides while you’re in the thick of things you can look back and see just how far you’ve come. This is the same feeling I get when hiking or cycling.

A view from the top

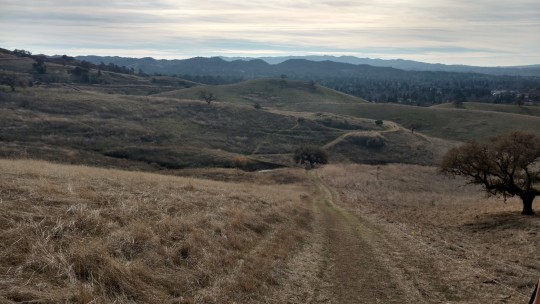
It doesn’t seem like you’re climbing that much but then you turn around and see how far you’ve gone and can admire the stunning view.
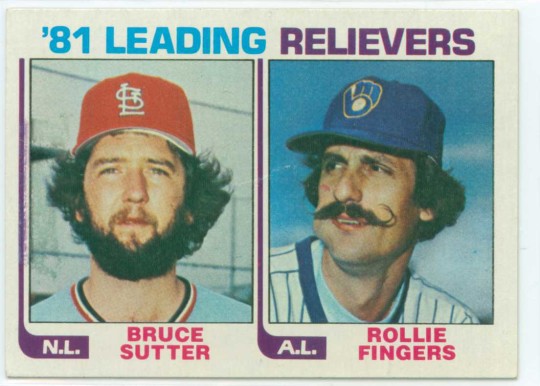
Response Times

One of the things I’ve battled for ages is the speed in which I reply to email. Worse is that the email I don’t respond to at all are for those that I’d like to help. It’s people who I don’t want to say no to but … should. I just don’t have the time.

So I’ll take that initial call and I’ll promise a proposal. I have the best intentions. But in the end I am deep into working and when I think about sending that proposal I can only think about how I’ll fit that work in if they say yes. So I put it off.

Those emails just sit there. Potential work and, more importantly, the promise of help are left dangling. I generally keep those threads as unread mail. Today I have four unread items in my inbox. They are all folks I just … ghosted.

Ghosted

I keep those threads as unread to remind me. Not so much to beat myself up but to ensure that I don’t get into those spots in the future. I can only do so much and while I’d like to do more I know I simply can’t.

If you are one of those four, I apologize. I still think about your projects. I’m happy when I see you mentioned in a mainstream article. I sincerely wish you the best.

Think It, Do It

Just Do It

The good news is that I’m vastly better at responding to most other email. I often got into the habit of thinking about what I have to do. Or thinking about how I’m going respond, essentially typing up the response in my head.

I’ve gotten much better at identifying when I’m doing this and instead actually do it. This has been really transformative. Because I find that it’s often the little things that build up and start weighing me down.

I know many would say that I should focus on the most impactful project first. But that hasn’t worked for me. It makes me less productive if I know there are six other things I need to get to. They all might be smaller tasks but my brain is crunching away on that stuff in the background.

It’s like firing up the Activity Monitor on your computer and seeing all those rogue processes spinning away drawing down the computing power. I need to close those out so I can get more computing power back.

I feel better when I get those small things done. It’s a mini victory of sorts. I can take that momentum and roll it into the larger projects I need to tackle.

Framing

Framing

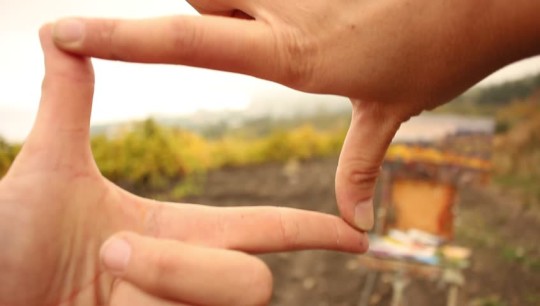
I realized that I’m incredibly good at framing. Not the artistic kind but the psychological kind.

For instance, I often tell people that I won the cancer lottery. If you’re going to get cancer, follicular lymphoma is the three cherries variety. I’ll die of something else long before this type of cancer takes me down.

I do this all the time. It’s not that I don’t acknowledge that something is tough or troubling. But how you frame it makes a huge difference in how you handle that situation.

Framing is marketing to yourself.

Framing doesn’t change the facts but it does change … how you perceive reality. I acknowledge that it’s a hell of a lot easier to do this when you’re white and financially secure. But I’ve done it my entire life. (Granted, I’ve always been white but not always financially secure.)

I moved out to San Diego with my now wife and we spent a year without a couch. We didn’t have enough money to go to full price movies. But we were together in beautiful San Diego.

I framed the move from Washington D.C to San Diego as an adventure. I framed it as doing something the vast majority don’t. So even if things didn’t work out, the attempt was worth it. The way I framed it, even failure was a success! It seems laughable. I mean, seriously, I’m chuckling to myself right now.

But by framing it that way I was able to enjoy that time so much more. I was able to be less stressed about the eventual outcome and instead just be present in the moment.

Juggling

Feeling Overwhelmed

I finally overcame my guilt of dropping the communications ball. The fact of the matter is that most of us are juggling a lot. And there are plenty of times when I’m on the receiving end of not getting a response.

A friend will put me in touch with someone and I’ll respond with some meeting times. Then I don’t hear from them for a month or more. Eventually they surface and apologize for the delay.

I’ll waive off the apology. “No worries, I totally understand.” Then we pick-up where we left off and see where things go.

I guess I’ve realized that people are far more forgiving about these things. I don’t think anyone intentionally decides they’re going to drop that email thread. Things just … happen.

Because, everything takes more time than you think it will. (See what I did there.)
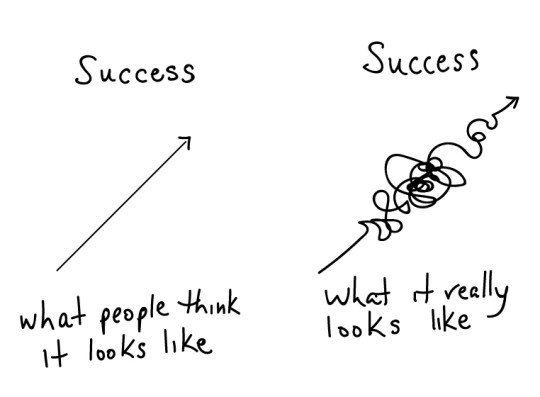
Success

Soup Dragon's Video Screencap

The business, which was already crazy good, continued to grow.

For a long time part of me figured that people resented my success. Why him and not me? And you know what, those people might be out there. But I no longer think that’s the majority.

In part, this is a realization that my success does not mean that others won’t find their own. This isn’t a zero sum game of people at the top and others at the bottom. I found a niche and others will and have found their own.

There are multiple pathways to success, even within our own small industry. And I’m more than happy to chat with other consultants and give them advice and document templates. There’s more than enough business out there.

Does the income disparity between myself and the average American still make me uneasy? Hell yeah. But me feeling guilty about spending the money I earn doesn’t do much about that except make me less happy.

Guilt is not a good form of activism.

I’m not a big consumer anyway. I don’t rush out to get the new phone or the new TV or the coolest clothes. I eat out a bit more. I travel. I donate more too. That doesn’t earn me gold stars, it’s just what it is.

What I did instead was register marginaltaxratesexplained.com the other week. So please get in touch if you’re a developer or designer who has any interest in educating folks on this topic. Because most people don’t get it.
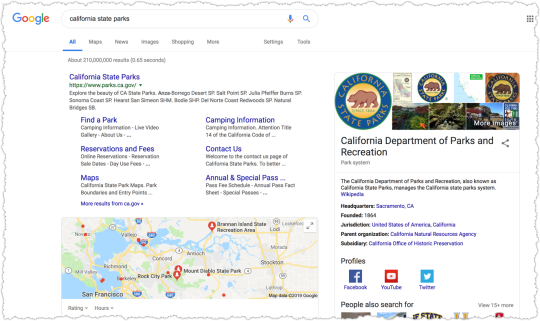
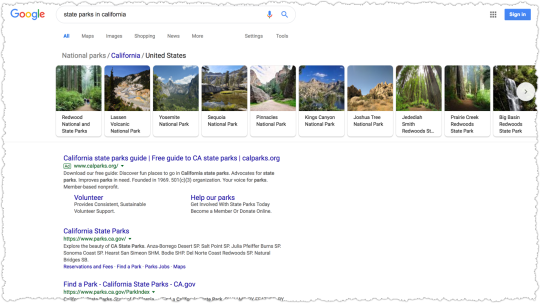
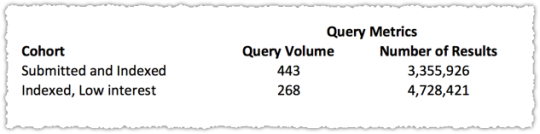
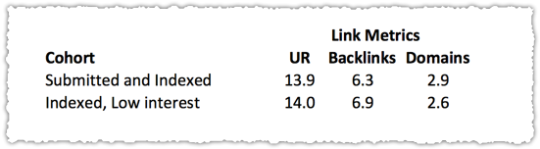
SEO Success

Last year I managed to launch one out of three ventures. It might sound like I was disappointed but in reality I think one out of three is pretty damn good. (Framing in action folks.)

The one I did manage to launch got traffic right off the bat. And each week it gets more. All this with less than 50 pages of content! It was really a proof of concept for a much larger idea. So 2019 will be about scaling.

I’m super excited about this site. But what it really did was confirm just how effective SEO can be when you approach it correctly. There’s so much opportunity!

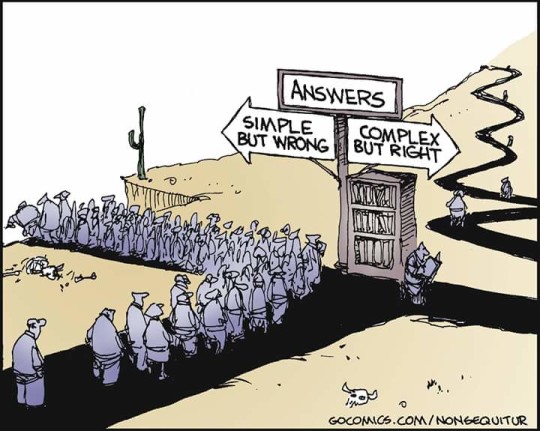
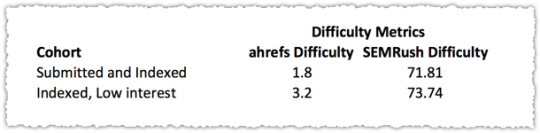
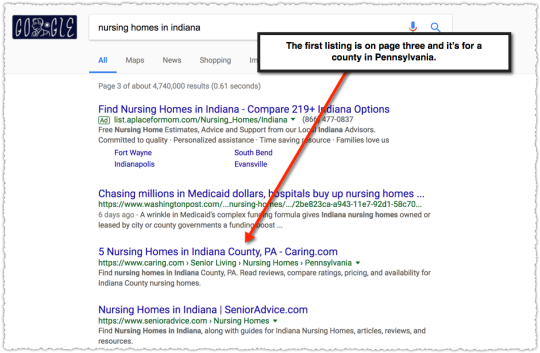
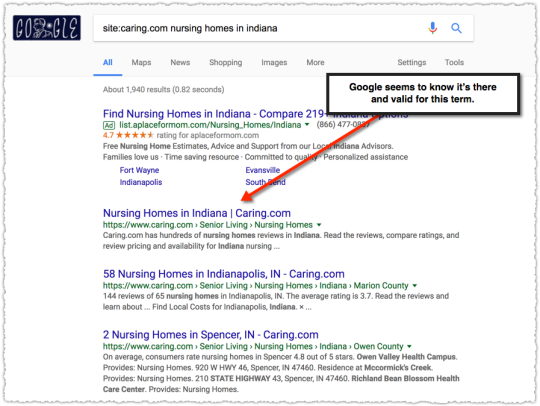
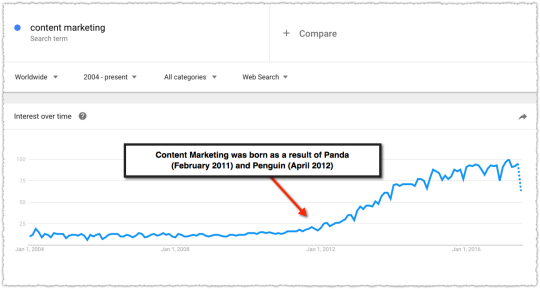
There’s a whisper campaign out there about how difficult SEO is getting. The SERPs are getting crowded out by ads and Google is taking away more clicks. It’s even worse on mobile where there’s less screen real estate right?

Sorry, but the sky is not falling. I’m not saying there aren’t challenges. I’m not saying things haven’t changed. It just means we need to change and adapt. Too many are still conducting business using Panda and Penguin as their guardrails.

SEO is easy when you understand how and why people are searching and work to satisfy their intent. That’s a bit of a simplification but … not by much. Target the keyword, optimize the intent. It’s been my mantra for years.

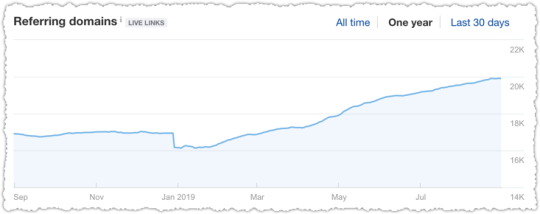
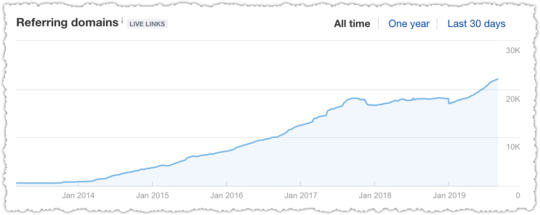
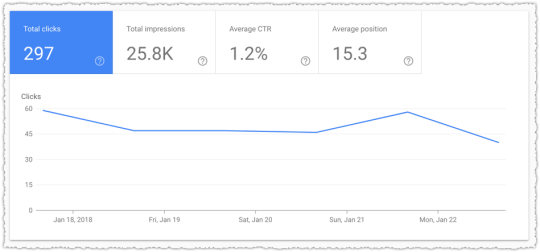
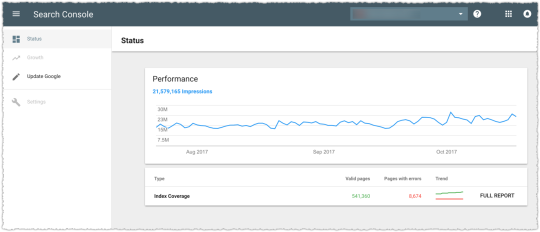
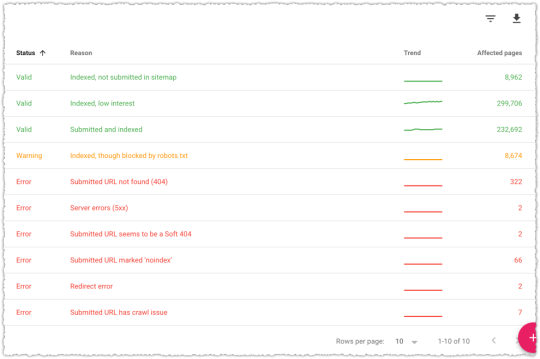
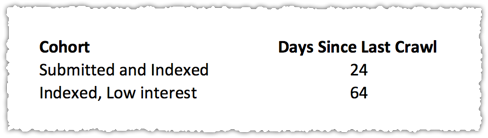
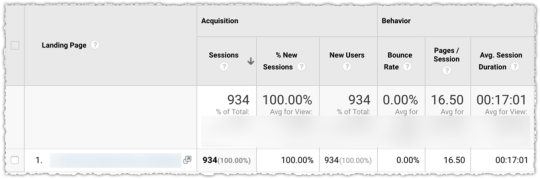
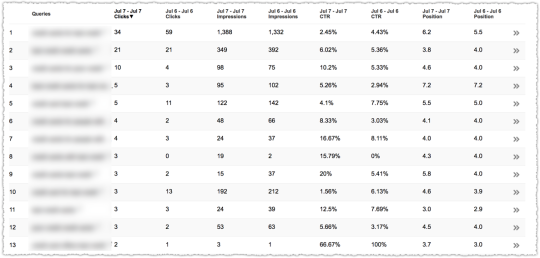
It’s great when you use this approach with a client, make a big bet, and see it pay off.

Rank Index Success Example

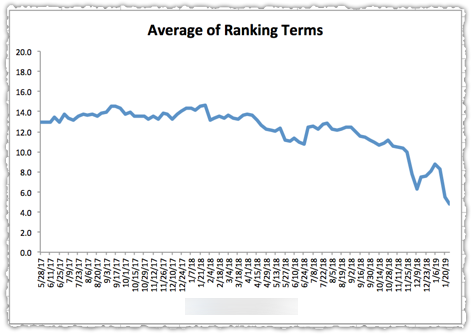
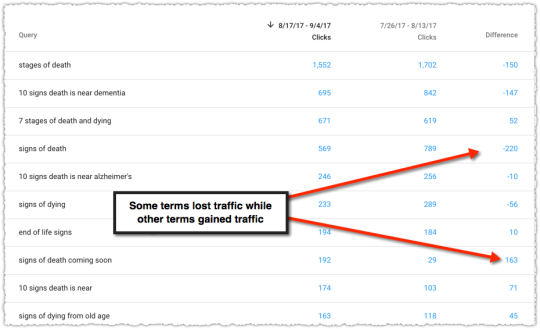
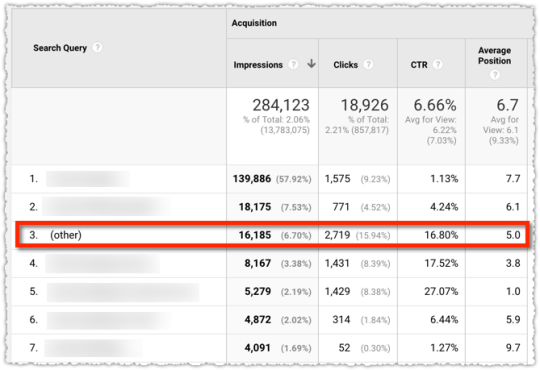
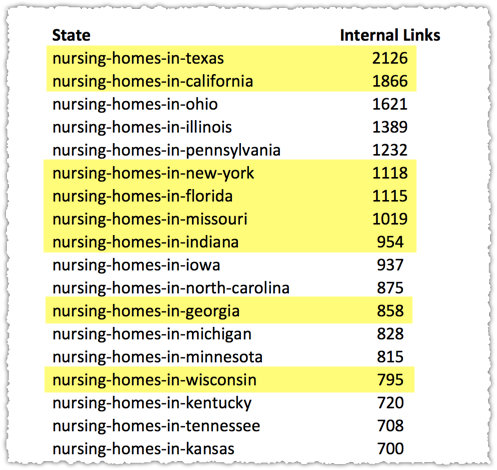
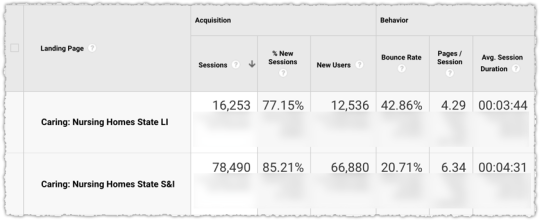
The graph above is the result of launching a geographic directory on a client site. Not only has the average rank for this important query class moved from the low teens to approximately four but the conversion rate increased by 30% or more for these queries.

More traffic. Better traffic.

What shouldn’t be downplayed here is that the requirements for the new page type where built around what users searching would expect to see when they landed. SEO was the driving force for product requirements.

SEO isn’t just about keyword research but about knowing what users expect after typing in those words.

Habits

Going into 2019 I’m focusing more on habits. In the past I’ve had explicit goals with varying degrees of success in achieving them.

I have 2019 goals but I also list the habit or habits that will help me reach each goal. I wound up putting on a lot of the weight I lost in 2017. So this year I’m going to lose 32 pounds and hit my target weight of 160.

To do that I’m going to journal my food and weigh myself every day. When I do those things, I know I have a much better chance of reaching that goal and maintaining it. Frankly, getting there is usually easy. I’m already down 12 pounds. Maintenance is more difficult.

Another example is my desire to read more. This is something I want to do but haven fallen short of in recent years. But this time I decided the habit to change was to read before bed instead of falling asleep to the TV.

I already use this methodology with a number of clients, whether it be in maintaining corpus control or in developing asynchronous link-building campaigns. So what’s good for the goose should be good for the gander, right?

Adapting

Adapt or Die

If you read through my ‘What I Learned’ series I think you’ll see that I am good at adapting to situations. In 2018, that was once again put to the test.

I took a nearly month long vacation in Europe. We went to London, Paris, Venice and the South of France. (As an aside, this was a no-work vacation and as such I did not bill clients for that month off. So it’s amazing that the business grew by 20% while I only billed 11 months of work.)

As a family we had a vision of what our vacation would be like. My wife had various ‘walking guides’ to the cities we’d be visiting. We couldn’t wait to go and imagined ourselves trekking around and exploring the rich history of each city.

But a few weeks before we were set to leave my daughter dislocated her kneecap. We were at a court warming up between tournament matches when she suddenly crumpled to the ground, howling in pain.

She had this same injury twice before so we knew the time to recover would extend well into our trip. She wouldn’t be able to walk for any long period of time. But here’s the thing. Instead of thinking about how awful it was going to be, we simply figured out a way to make it work.

I bought foldable canes and we rented a wheelchair when we were in London. It wasn’t what we planned but it worked out amazingly well. I pushed her around London in the wheelchair and you’d be amazed at how many lines you can cut when your child is in that chair or has on a brace and limps around using a cane.

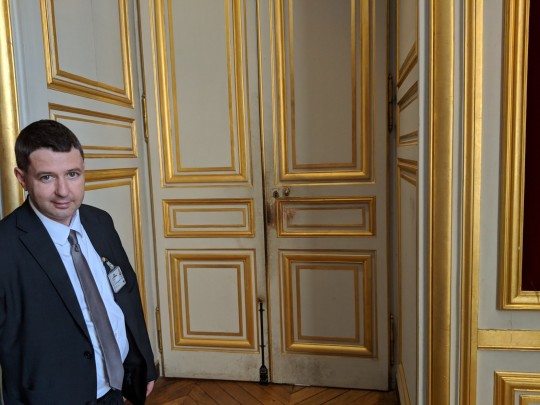
I kid you not, when we went to Versailles, the line to get in was horrendous. Hours for sure. I got in line while my wife and daughter (limping with her cane) went to the front to ask if there was a wheelchair available. The result? We jumped that line and got to see some of the back rooms of Versailles as we secured her wheelchair.

Here’s the back room entrance to the Palace of Versailles.

Back Room Entrance at Palace of Versailles

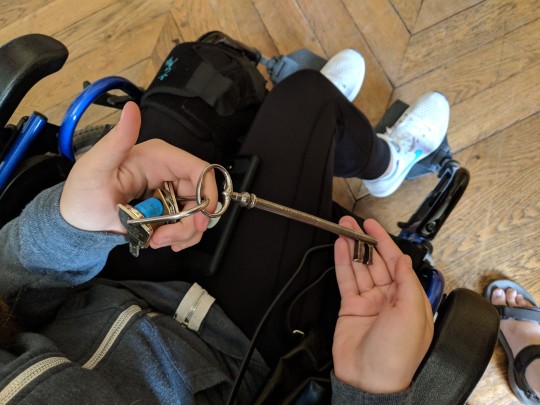
And here’s the crazy ass key that still opens that door.

Key to Versailles

The point here is that you have to deal with the reality that is right in front of you and not what you hoped it might be. When you embrace the here and now it can turn out to be pretty awesome.

If you take anything away from this post I hope it is this. Because nothing good comes from trying to navigate life when you’re constantly thinking it should have been different.

But that wasn’t what really pushed our ability to adapt. Instead, it was what happened the first night we were in our villa in the South of France.

The Long Story

(Seriously, this is a long story so if you want to bail now that’s cool. I’m going to try to keep it short but it’s still going to be long. I think it ties things together but you might disagree. So … you’ve been warned.)

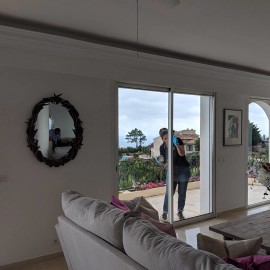
We rented a gorgeous villa in Saint-Raphaël with a pool and a gorgeous view. It was going to be the relaxing part of a very busy vacation.

I was asleep on the couch downstairs (because I snore) when my wife woke me up by yelling, “AJ, there’s someone in the house!” Heart pounding, I bounded upstairs and saw the briefest of motion to my right and ran to where the sliding glass door was open. I guess I was chasing the burglar out?

I didn’t see much so I ran back inside and checked on my wife (who was fine and, incidentally, a badass) and then immediately went back downstairs to check on my daughter who was in an entirely different room. She was fine and still asleep.

We composed ourselves and took inventory. The burglar had stolen some jewelry, our phones, my wallet and my backpack, which had … our passports. Ugh! They’d pulled my wife’s suitcase out of her room and had rummaged through it and were going back to do the same with mine when my wife woke up and scared him off.

In short, someone had broken into our villa while we slept and robbed us. It was scary as fuck. But it all could have been a whole lot worse. No one was hurt. You can always get ‘things’ back.

And we did almost instantly. The guy must have been so freaked at being chased that he’d dropped my wife’s purse as he fled. I found it just outside on the balcony. Inside? Her wallet and brand new camera! Losing the wallet would have been one thing but the thought of losing a whole trip worth of photos would have been a real blow.

We started making calls, struggling through the international dialing codes while adrenaline continued to course through our veins. We called the property manager, our travel insurance provider and my credit card companies.

It was 3 in the morning so the first few hours weren’t that productive but it allowed us to calm down and come up with a plan of action. By 7 am we starting to hear from everyone and the wheels were put into motion.

Our contact for the rental was Brent Tyler, a Brit who was quite the character. He was always ‘on’ and had a witty response for damn near everything. He’d even written a book about moving from Cookham to Cannes. But what mattered that day was that he spoke fluent French, which was going to be instrumental in helping deal with the local police.

Because that’s what we had to do. The local police came by and then they sent the CSI team later on to take prints and DNA evidence.

French CSIDusting for Prints

Then we had to go to Fréjus to file a police report.

It was a small station fortified by two massive lucite looking doors where you had to be buzzed in. The police officer was a French female version of a stereotypical lazy sheriff. She wasn’t keen to do much for tourists.

But that all changed when she met Brent.

Oh, she had a thing for him! So here I am watching these two flirt as they go through the list of items that were stolen. His French is good but not perfect and she finds that endearing. She’s asking what something means and he’s trying to find the right words to describe it.

I know the French word for yes is ‘oui’ but quickly learn that ‘yeah’ is ‘ouais’ which sounds like ‘whey’. Because this is how Brent responds when he and this police officer settle on something. “Whey, whey, whey, whey” Brent nods as the police officer grins.

It is an odd thing to be in such an awful situation but see these ebullient interactions. I didn’t know whether to be annoyed or happy for the distraction.

Either way we were able to get the report filed, which was particularly good for insurance purposes. Check that off our list and move on. We were feeling good about things.

That’s saying a lot too because Brent never told us to keep all the steel shutters down at night. Hell we didn’t even know the place came with steel shutters! If we’d been told, no one could have broken in. So we had to rely on someone who we were a bit angry with at the time. I think we all figured out a way to make it work and that’s sort of the point.

On the way back to the villa we stopped to get passport photos. Because the next day we had to drive to the U.S. Consulate in Marseille to get new passports. Here’s what I looked like in those photos.

French Passport Photos

They tell you not to smile so I look both tired and pissed off. It’s a nice Andy Warhol type effect though and looking at it now actually makes me smile.

Later that day, someone buzzed at the front gate of the villa and asked if I was there. Who the hell was asking for me here? But it soon became clear that this gentleman had found my driver’s license.

I let him in and learned that he too had been burgled last night along with two others in the neighborhood. They’d taken his glasses and some expensive photography equipment. He was from the Netherlands and said his son found my license out by their trash cans in the morning.

I thanked him profusely and once he left went out to see if I could locate any other items. I trekked up and down those windy roads. I didn’t find anything, though I did meet some very friendly goats.

Friendly French Goats
The next day we drove to Marseille, which was over two hours away. It was a stressful trip.

Things are just different enough to make things difficult. What button do I press and how much do I have to pay at this toll? Why isn’t it working!? What am I doing wrong?! There are cars behind us!

Maybe it was our mood or perhaps it was the area of town but … Marseille was not my jam. It all felt a bit sketch. But again, perhaps my paranoia was just at a high point that day.

We had an appointment at the U.S. Consulate but even then it was like entering some nuclear bunker. The guardhouse had a “sniper map” with a picture of their view of the street in grid format. So if there’s a threat approaching they could simply call in a grid code and, well, I’m not sure what happens but I figure it would be like something out of Sicario.

Past the guardhouse we were led into an interior room where you can’t take anything electronic inside. At this point it doesn’t feel like those movies where you run to the embassy for assistance and they say “you’re okay, now you’re on American soil.” No, it was the TSA on steroids instead.

Once inside it turned out to be a pretty mundane room that, apparently, hadn’t been updated since the late 80s. A state department worker tells us that we can start the process of getting new passports by filling out the forms online. Oh, and those passport photos we got aren’t going to work. It’s a total scam. They’ll take our photos here instead.

My wife and I start filling out the forms online and just as we’re about to move on to my daughter’s passport the state department woman barges out and tells us to stop. It’s … dramatic. She’s just received a call that someone, a neighbor, has found our passports!

Yes, while we are there applying for new passports, someone called to tell us they found our stolen passports. This neighbor called the police in Fréjus who said they had no information on lost passports. (Yeah, not true!) So he took the next step and called the U.S. Embassy in Paris, who then put him through to our contact in Marseilles.

I am in awe that this stranger went to these lengths and at the incredible timing of his call. The state department contact tells us that this is only the second time in ten years that this has happened.

She goes on to tell us that these break-ins are a huge problem in the area and have been getting worse over the past few years. They come in through the forest to avoid the gates that bar entrance to the community on the road. She describes a pile of found credit cards and passports at the end of every season.

She checks to make sure that our new passport requests haven’t gone through and we arrange to meet with our neighbor later that day when we return. Things are looking up so we take the scenic way home and spend a few hours at the beach in La Ciotat.

Once home we meet up with our neighbors who tell us my passport case was hidden in his wheel well. Not only are the passports there but they missed the cash I’d stuffed into one of the interior pockets. Bonus!

Our neighbors are very funny and kind. They also tell us that they too were burgled many years ago and that’s why they had steel shutters installed. Ah, if only we’d known.

Sleeping in the villa is still difficult but … we make it work and try to have as much fun as we can. Not having our phones is a pain but my daughter’s phone and the iPad were left untouched so we’re still digitally functional.

But it’s not quite over.

On Monday we get an email confirming that our passports have been cancelled. What the hell! It turns out the online forms we’d filled out were, in fact, submitted. So the next few days are spent talking and emailing with our state department contact.

She is clearly embarrassed that she sent us home only to get this notice a few days later. She reaches out to DHS and asks them to undo the cancellation. Our contact even sends me a snippet of her Skype conversation where the DHS says that they’re not supposed to do that anymore but … they’ll make an exception.

So it seems like we’re in the clear. The problem is she isn’t quite sure if the new status will propagate through the entire border control database before we depart. There’s a chance we go to leave via Charles de Gaulle and are suddenly being swarmed by folks with guns wearing body armor.

The odds are that won’t happen but it’s still hard not to think about that potential outcome. At some point I just figured that if the worst did happen it would mean another week at a hotel and a few more days in Paris. It might be inconvenient and expensive but things would work out.

Of course, nothing of the sort happened. We handed a stone faced man our passports and he stamped them and with a sigh of relief we went to get something to eat before we boarded the plane.

The Take Aways

See, I told you it was a long story. But here’s the thing. I still think of that vacation as being … great. I could certainly frame it differently. I could frame it as how our grand vacation was ruined by this awful event. But I don’t. What does that accomplish?

I am not saying everything happens for a reason. I hate that saying. Instead, I’d simply say that chaos is the general thread of all life. How you handle it is what matters.

I also think of all the people that helped us. Sure there was the dirtbag who broke in and stole our stuff but there were more people who chipped in to get us back on our feet. Even the dirtbag didn’t hurt anyone and actually left our passports in a place where they were likely to be found. I’d like to believe that was on purpose.

I was also able to see that my anger at Brent wasn’t useful. I could tell he felt like shit and was willing to do what he could to assist us as a result. Even the French police officer who didn’t seem to care … came through in her own way.

Now, I don’t think these things happen just by accident. I don’t think we would have received as much help as we did if we weren’t working on side hustles to help ourselves, to be our own advocate and to ask for what we needed. Like I said, the thread of every life is chaos. It’s not if something is going to happen it’s when.

So it’s up to you to do as much as you can. When others see that you’re willing to try, they try too. Can it be that simple? I don’t know.

Conversely, it also struck me that this incident was both a big deal and meaningless at the same time. At the end of the day, it does turn into a story. It’s fodder for a blog post. Lives go on. Business continues. No one truly cares. I mean, people care but … it’s not a huge deal.

There were three other families who had the same experience. What I went through was not unique. That is oddly comforting. Just as it is when I think about my business issues. They are not unique. They’re still important but I try not to take them too seriously.

I took two other things away from this experience that might not be apparent from my narrative. The first is that exceptions can be made so everyone doesn’t get the same treatment.

While there’s no guarantee that you’ll be the exception to that rule, you never know unless you ask. Ask nicely but never settle. Never stop pushing because you’re not bumping up against something like gravity or the first law of motion. These are not immutable laws. They are rules made by imperfect humans. Sometimes they can change or be bent.

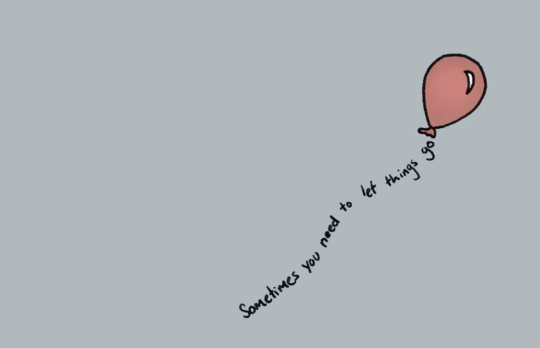
The second take away was that you need the help of others to reach your goals. I am perpetually grateful to the many folks who helped me get to where I am and continue to help me to this day. But it goes beyond that. Historically, I am very bad at letting go of things. I like doing things myself. I get fed up easily and feel like many are simply allergic to work.

But I was put in a situation where I needed the guy who spoke French and the woman fighting to un-cancel our passports. I couldn’t do those things. So it’s one thing to know that others help you achieve your goals but it’s quite another to experience it first hand.

As a result I’ve been able to take my hands off the reigns a lot more and let others do what they’re good at, leaving me more time to … think.

Algorithm Analysis In The Age of Embeddings

November 19 2018 // Analytics + SEO // 55 Comments

On August 1st, 2018 an algorithm update took 50% of traffic from a client site in the automotive vertical. An analysis of the update made me certain that the best course of action was … to do nothing. So what happened?

Algorithm Changes Google Analytics

Sure enough, on October 5th, that site regained all of its traffic. Here’s why I was sure doing nothing was the right thing to do and why I dismissed any E-A-T chatter.

E-A-T My Shorts

Eat Pant

I find the obsession with the Google Rating Guidelines to be unhealthy for the SEO community. If you’re unfamiliar with this acronym it stands for Expertise, Authoritativeness and Trustworthiness. It’s central to the published Google Rating Guidelines.

The problem is those guidelines and E-A-T are not algorithm signals. Don’t believe me? Believe Ben Gomes, long-time search quality engineer and new head of search at Google.

“You can view the rater guidelines as where we want the search algorithm to go,” Ben Gomes, Google’s vice president of search, assistant and news, told CNBC. “They don’t tell you how the algorithm is ranking results, but they fundamentally show what the algorithm should do.”

So I am triggered when I hear someone say they “turned up the weight of expertise” in a recent algorithm update. Even if the premise were true, you have to connect that to how the algorithm would reflect that change. How would Google make changes algorithmically to reflect higher expertise?

Google doesn’t have three big knobs in a dark office protected by biometric scanners that allows them to change E-A-T at will.

Tracking Google Ratings

Before I move on I’ll do a deeper dive into quality ratings. I poked around to see if there are material patterns to Google ratings and algorithmic changes. It’s pretty easy to look at referring traffic from the sites that perform ratings.

Tracking Google Ratings in Analytics

The four sites I’ve identified are raterlabs.com, raterhub.com, leapforceathome.com and appen.com. At present there’s really only variants of appen.com, which rebranded in the last few months. Either way, create an advanced segment and you can start to see when raters have visited your site.

And yes, these are ratings. A quick look at the referral path makes it clear.

Raters Program Referral Path

The /qrp/ stands for quality rating program and the needs_met_simulator seems pretty self-explanatory.

It can be interesting to then look at the downstream traffic for these domains.

SEMRush Downstream Traffic for Raterhub.com

Go the extra distance and you can determine what page(s) the raters are accessing on your site. Oddly, they generally seem to focus on one or two pages, using them as a representative for quality.

Beyond that, the patterns are hard to tease out, particularly since I’m unsure what tasks are truly being performed. A much larger set of this data across hundreds (perhaps thousands) of domains might produce some insight but for now it seems a lot like reading tea leaves.

Acceptance and Training

The quality rating program has been described in many ways so I’ve always been hesitant to label it one thing or another. Is it a way for Google to see if their recent algorithm changes were effective or is it a way for Google to gather training data to inform algorithm changes?

The answer seems to be yes.

Appen Home Page Messaging

Appen is the company that recruits quality raters. And their pitch makes it pretty clear that they feel their mission is to provide training data for machine learning via human interactions. Essentially, they crowdsource labeled data, which is highly sought after in machine learning.

The question then becomes how much Google relies on and uses this set of data for their machine learning algorithms.

“Reading” The Quality Rating Guidelines

Invisible Ink

To understand how much Google relies on this data, I think it’s instructive to look at the guidelines again. But for me it’s more about what the guidelines don’t mention than what they do mention.

What query classes and verticals does Google seem to focus on in the rating guidelines and which ones are essentially invisible? Sure, the guidelines can be applied broadly, but one has to think about why there’s a larger focus on … say, recipes and lyrics, right?

Beyond that, do you think Google could rely on ratings that cover a microscopic percentage of total queries? Seriously. Think about that. The query universe is massive! Even the query class universe is huge.

And Google doesn’t seem to be adding resources here. Instead, in 2017 they actually cut resources for raters. Now perhaps that’s changed but … I still can’t see this being a comprehensive way to inform the algorithm.

The raters clearly function as a broad acceptance check on algorithm changes (though I’d guess these qualitative measures wouldn’t outweigh the quantitative measures of success) but also seem to be deployed more tactically when Google needs specific feedback or training data for a problem.

Most recently that was the case with the fake news problem. And at the beginning of the quality rater program I’m guessing they were struggling with … lyrics and recipes.

So if we think back to what Ben Gomes says, the way we should be reading the guidelines is about what areas of focus Google is most interested in tackling algorithmically. As such I’m vastly more interested in what they say about queries with multiple meanings and understanding user intent.

At the end of the day, while the rating guidelines are interesting and provide excellent context, I’m looking elsewhere when analyzing algorithm changes.

Look At The SERP

This Tweet by Gianluca resonated strongly with me. There’s so much to be learned after an algorithm update by actually looking at search results, particularly if you’re tracking traffic by query class. Doing so I came to a simple conclusion.

For the last 18 months or so most algorithm updates have been what I refer to as language understanding updates.

This is part of a larger effort by Google around Natural Language Understanding (NLU), sort of a next generation of Natural Language Processing (NLP). Language understanding updates have a profound impact on what type of content is more relevant for a given query.

For those that hang on John Mueller’s every word, you’ll recognize that many times he’ll say that it’s simply about content being more relevant. He’s right. I just don’t think many are listening. They’re hearing him say that, but they’re not listening to what it means.

Neural Matching

The big news in late September 2018 was around neural matching.

But we’ve now reached the point where neural networks can help us take a major leap forward from understanding words to understanding concepts. Neural embeddings, an approach developed in the field of neural networks, allow us to transform words to fuzzier representations of the underlying concepts, and then match the concepts in the query with the concepts in the document. We call this technique neural matching. This can enable us to address queries like: “why does my TV look strange?” to surface the most relevant results for that question, even if the exact words aren’t contained in the page. (By the way, it turns out the reason is called the soap opera effect).

Danny Sullivan went on to refer to them as super synonyms and a number of blog posts sought to cover this new topic. And while neural matching is interesting, I think the underlying field of neural embeddings is far more important.

Watching search results and analyzing keyword trends you can see how the content Google chooses to surface for certain queries changes over time. Seriously folks, there’s so much value in looking at how the mix of content changes on a SERP.

For instance, the query ‘Toyota Camry Repair’ is part of a query class that has fractured intent. What is it that people are looking for when they search this term? Are they looking for repair manuals? For repair shops? For do-it-yourself content on repairing that specific make and model?

Google doesn’t know. So it’s been cycling through these different intents to see which of them performs the best. You wake up one day and it’s repair manuals. A month of so later they essentially disappear.

Now, obviously this isn’t done manually. It’s not even done in a traditional algorithmic sense. Instead it’s done through neural embeddings and machine learning.

Neural Embeddings

Let me first start out by saying that I found a lot more here than I expected as I did my due diligence. Previously, I had done enough reading and research to get a sense of what was happening to help inform and explain algorithmic changes.

And while I wasn’t wrong, I found I was way behind on just how much had been taking place over the last few years in the realm of Natural Language Understanding.

Oddly, one of the better places to start is at the end. Very recently, Google open-sourced something called BERT.

Bert

BERT stands for Bidirectional Encoder Representations from Transformers and is a new technique for pre-NLP training.  Yeah, it gets dense quickly. But the following excerpt helped put things into perspective.

Pre-trained representations can either be context-free or contextual, and contextual representations can further be unidirectional or bidirectional. Context-free models such as word2vec or GloVe generate a single word embedding representation for each word in the vocabulary. For example, the word “bank” would have the same context-free representation in “bank account” and “bank of the river.” Contextual models instead generate a representation of each word that is based on the other words in the sentence. For example, in the sentence “I accessed the bank account,” a unidirectional contextual model would represent “bank” based on “I accessed the” but not “account.” However, BERT represents “bank” using both its previous and next context — “I accessed the … account” — starting from the very bottom of a deep neural network, making it deeply bidirectional.

I was pretty well-versed in how word2vec worked but I struggled to understand how intent might be represented. In short, how would Google be able to change the relevant content delivered on ‘Toyota Camry Repair’ algorithmically?  The answer is, in some ways, contextual word embedding models.

Vectors

None of this may make sense if you don’t understand vectors. I believe many, unfortunately, run for the hills when the conversation turns to vectors. I’ve always referred to vectors as ways to represent words (or sentences or documents) via numbers and math.

I think these two slides from a 2015 Yoav Goldberg presentation on Demystifying Neural Word Embeddings does a better job of describing this relationship.

Words as Vectors

So you don’t have to fully understand the verbiage of “sparse, high dimensional” or the math behind cosine distance to grok how vectors work and can reflect similarity.

You shall know a word by the company it keeps.

That’s a famous quote from John Rupert Firth, a prominent linguist and the general idea we’re getting at with vectors.

word2vec

In 2013, Google open-sourced word2vec, which was a real turning point in Natural Language Understanding. I think many in the SEO community saw this initial graph.

Country to Capital Relationships

Cool right? In addition there was some awe around vector arithmetic where the model could predict that [King] – [Man] + [Woman] = [Queen]. It was a revelation of sorts that semantic and syntactic structures were preserved.

Or in other words, vector math really reflected natural language!

What I lost track of was how the NLU community began to unpack word2vec to better understand how it worked and how it might be fine tuned. A lot has happened since 2013 and I’d be thunderstruck if much of it hadn’t worked its way into search.

Context

These 2014 slides about Dependency Based Word Embeddings really drives the point home. I think the whole deck is great but I’ll cherry pick to help connect the dots and along the way try to explain some terminology.

The example used is looking at how you might represent the word ‘discovers’. Using a bag of words (BoW) context with a window of 2 you only capture the two words before and after the target word. The window is the number of words around the target that will be used to represent the embedding.

Word Embeddings using BoW Context

So here, telescope would not be part of the representation. But you don’t have to use a simple BoW context. What if you used another method to create the context or relationship between words. Instead of simple words-before and words-after what if you used syntactic dependency – a type of representation of grammar.

Embedding based on Syntactic Dependency

Suddenly telescope is part of the embedding. So you could use either method and you’d get very different results.

Embeddings Using Different Contexts

Syntactic dependency embeddings induce functional similarity. BoW embeddings induce topical similarity. While this specific case is interesting the bigger epiphany is that embeddings can change based on how they are generated.

Google’s understanding of the meaning of words can change.

Context is one way, the size of the window is another, the type of text you use to train it or the amount of text it’s using are all ways that might influence the embeddings. And I’m certain there are other ways that I’m not mentioning here.

Beyond Words

Words are building blocks for sentences. Sentences building blocks for paragraphs. Paragraphs building blocks for documents.

Sentence vectors are a hot topic as you can see from Skip Thought Vectors in 2015 to An Efficient Framework for Learning Sentence RepresentationsUniversal Sentence Encoder and Learning Semantic Textual Similarity from Conversations in 2018.

Universal Sentence Encoders

Google (Tomas Mikolov in particular before he headed over to Facebook) has also done research in paragraph vectors. As you might expect, paragraph vectors are in many ways a combination of word vectors.

In our Paragraph Vector framework (see Figure 2), every paragraph is mapped to a unique vector, represented by a column in matrix D and every word is also mapped to a unique vector, represented by a column in matrix W. The paragraph vector and word vectors are averaged or concatenated to predict the next word in a context. In the experiments, we use concatenation as the method to combine the vectors.

The paragraph token can be thought of as another word. It acts as a memory that remembers what is missing from the current context – or the topic of the paragraph. For this reason, we often call this model the Distributed Memory Model of Paragraph Vectors (PV-DM).

The knowledge that you can create vectors to represent sentences, paragraphs and documents is important. But it’s more important if you think about the prior example of how those embeddings can change. If the word vectors change then the paragraph vectors would change as well.

And that’s not even taking into account the different ways you might create vectors for variable-length text (aka sentences, paragraphs and documents).

Neural embeddings will change relevance no matter what level Google is using to understand documents.

Questions

But Why?

You might wonder why there’s such a flurry of work on sentences. Thing is, many of those sentences are questions. And the amount of research around question and answering is at an all-time high.

This is, in part, because the data sets around Q&A are robust. In other words, it’s really easy to train and evaluate models. But it’s also clearly because Google sees the future of search in conversational search platforms such as voice and assistant search.

Apart from the research, or the increasing prevalence of featured snippets, just look at the title Ben Gomes holds: vice president of search, assistant and news. Search and assistant are being managed by the same individual.

Understanding Google’s structure and current priorities should help future proof your SEO efforts.

Relevance Matching and Ranking

Obviously you’re wondering if any of this is actually showing up in search. Now, even without finding research that supports this theory, I think the answer is clear given the amount of time since word2vec was released (5 years), the focus on this area of research (Google Brain has an area of focus on NLU) and advances in technology to support and productize this type of work (TensorFlow, Transformer and TPUs).

But there is plenty of research that shows how this work is being integrated into search. Perhaps the easiest is one others have mentioned in relation to Neural Matching.

DRMM with Context Sensitive Embeddings

The highlighted part makes it clear that this model for matching queries and documents moves beyond context-insensitive encodings to rich context-sensitive encodings. (Remember that BERT relies on context-sensitive encodings.)

Think for a moment about how the matching model might change if you swapped the BoW context for the Syntactic Dependency context in the example above.

Frankly, there’s a ton of research around relevance matching that I need to catch up on. But my head is starting to hurt and it’s time to bring this back down from the theoretical to the observable.

Syntax Changes

I became interested in this topic when I saw certain patterns emerge during algorithm changes. A client might see a decline in a page type but within that page type some increased while others decreased.

The disparity there alone was enough to make me take a closer look. And when I did I noticed that many of those pages that saw a decline didn’t see a decline in all keywords for that page.

Instead, I found that a page might lose traffic for one query phrase but then gain back part of that traffic on a very similar query phrase. The difference between the two queries was sometimes small but clearly enough that Google’s relevance matching had changed.

Pages suddenly ranked for one type of syntax and not another.

Here’s one of the examples that sparked my interest in August of 2017.

Query Syntax Changes During Algorithm Updates

This page saw both losers and winners from a query perspective. We’re not talking small disparities either. They lost a lot on some but saw a large gain in others. I was particularly interested in the queries where they gained traffic.

Identifying Syntax Winners

The queries with the biggest percentage gains were with modifiers of ‘coming soon’ and ‘approaching’. I considered those synonyms of sorts and came to the conclusion that this page (document) was now better matching for these types of queries. Even the gains in terms with the word ‘before’ might match those other modifiers from a loose syntactic perspective.

Did Google change the context of their embeddings? Or change the window? I’m not sure but it’s clear that the page is still relevant to a constellation of topical queries but that some are more relevant and some less based on Google’s understanding of language.

Most recent algorithm updates seem to be changes in the embeddings used to inform the relevance matching algorithms.

Language Understanding Updates

If you believe that Google is rolling out language understanding updates then the rate of algorithm changes makes more sense. As I mentioned above there could be numerous ways that Google tweaks the embeddings or the relevance matching algorithm itself.

Not only that but all of this is being done with machine learning. The update is rolled out and then there’s a measurement of success based on time to long click or how quickly a search result satisfies intent. The feedback or reinforcement learning helps Google understand if that update was positive or negative.

One of my recent vague Tweets was about this observation.

Or the dataset that feeds an embedding pipeline might update and the new training model is then fed into system. This could also be vertical specific as well since Google might utilize a vertical specific embeddings.

August 1 Error

Based on that last statement you might think that I thought the ‘medic update’ was aptly named. But you’d be wrong. I saw nothing in my analysis that led me to believe that this update was utilizing a vertical specific embedding for health.

The first thing I do after an update is look at the SERPs. What changed? What is now ranking that wasn’t before? This is the first way I can start to pick up the ‘scent’ of the change.

There are times when you look at the newly ranked pages and, while you may not like it, you can understand why they’re ranking. That may suck for your client but I try to be objective. But there are times you look and the results just look bad.

Misheard Lyrics

The new content ranking didn’t match the intent of the queries.

I had three clients who were impacted by the change and I simply didn’t see how the newly ranked pages would effectively translate into better time to long click metrics. By my way of thinking, something had gone wrong during this language update.

So I wasn’t keen on running around making changes for no good reason. I’m not going to optimize for a misheard lyric. I figured the machine would eventually learn that this language update was sub-optimal.

It took longer than I’d have liked but sure enough on October 5th things reverted back to normal.

August 1 Updates

Where's Waldo

However, there were two things included in the August 1 update that didn’t revert. The first was the YouTube carousel. I’d call it the Video carousel but it’s overwhelmingly YouTube so lets just call a spade a spade.

Google seems to think that the intent of many queries can be met by video content. To me, this is an over-reach. I think the idea behind this unit is the old “you’ve got chocolate in my peanut butter” philosophy but instead it’s more like chocolate in mustard. When people want video content they … go search on YouTube.

The YouTube carousel is still present but its footprint is diminishing. That said, it’ll suck a lot of clicks away from a SERP.

The other change was far more important and is still relevant today. Google chose to match question queries with documents that matched more precisely. In other words, longer documents receiving questions lost out to shorter documents that matched that query.

This did not come as a surprise to me since the user experience is abysmal for questions matching long documents. If the answer to your question is in the 8th paragraph of a piece of content you’re going to be really frustrated. Google isn’t going to anchor you to that section of the content. Instead you’ll have to scroll and search for it.

Playing hide and go seek for your answer won’t satisfy intent.

This would certainly show up in engagement and time to long click metrics. However, my guess is that this was a larger refinement where documents that matched well for a query where there were multiple vector matches were scored lower than those where there were fewer matches. Essentially, content that was more focused would score better.

Am I right? I’m not sure. Either way, it’s important to think about how these things might be accomplished algorithmically. More important in this instance is how you optimize based on this knowledge.

Do You Even Optimize?

So what do you do if you begin to embrace this new world of language understanding updates? How can you, as an SEO, react to these changes?

Traffic and Syntax Analysis

The first thing you can do is analyze updates more rationally. Time is a precious resource so spend it looking at the syntax of terms that gained and lost traffic.

Unfortunately, many of the changes happen on queries with multiple words. This would make sense since understanding and matching those long-tail queries would change more based on the understanding of language. Because of this, many of the updates result in material ‘hidden’ traffic changes.

All those queries that Google hides because they’re personally identifiable are ripe for change.

That’s why I spent so much time investigating hidden traffic. With that metric, I could better see when a site or page had taken a hit on long-tail queries. Sometimes you could make predictions on what type of long-tail queries were lost based on the losses seen in visible queries. Other times, not so much.

Either way, you should be looking at the SERPs, tracking changes to keyword syntax, checking on hidden traffic and doing so through the lens of query classes if at all possible.

Content Optimization

This post is quite long and Justin Briggs has already done a great job of describing how to do this type of optimization in his On-page SEO for NLP post. How you write is really, really important.

My philosophy of SEO has always been to make it as easy as possible for Google to understand content. A lot of that is technical but it’s also about how content is written, formatted and structured. Sloppy writing will lead to sloppy embedding matches.

Look at how your content is written and tighten it up. Make it easier for Google (and your users) to understand.

Intent Optimization

Generally you can look at a SERP and begin to classify each result in terms of what intent it might meet or what type of content is being presented. Sometimes it’s as easy as informational versus commercial. Other times there are different types of informational content.

Certain query modifiers may match a specific intent. In its simplest form, a query with ‘best’ likely requires a list format with multiple options. But it could also be the knowledge that the mix of content on a SERP changed, which would point to changes in what intent Google felt was more relevant for that query.

If you follow the arc of this story, that type of change is possible if something like BERT is used with context sensitive embeddings that are receiving reinforcement learning from SERPs.

I’d also look to see if you’re aggregating intent. Satisfy active and passive intent and you’re more likely to win. At the end of the day it’s as simple as ‘target the keyword, optimize the intent’. Easier said than done I know. But that’s why some rank well and others don’t.

This is also the time to use the rater guidelines (see I’m not saying you write them off completely) to make sure you’re meeting the expectations of what ‘good content’ looks like. If your main content is buried under a whole bunch of cruft you might have a problem.

Much of what I see in the rater guidelines is about capturing attention as quickly as possible and, once captured, optimizing that attention. You want to mirror what the user searched for so they instantly know they got to the right place. Then you have to convince them that it’s the ‘right’ answer to their query.

Engagement Optimization

How do you know if you’re optimizing intent? That’s really the $25,000 question. It’s not enough to think you’re satisfying intent. You need some way to measure that.

Conversion rate can be one proxy? So too can bounce rate to some degree. But there are plenty of one page sessions that satisfy intent. The bounce rate on a site like StackOverflow is super high. But that’s because of the nature of the queries and the exactness of the content. I still think measuring adjusted bounce rate over a long period of time can be an interesting data point.

I’m far more interested in user interactions. Did they scroll? Did they get to the bottom of the page? Did they interact with something on the page? These can all be tracking in Google Analytics as events and the total number of interactions can then be measured over time.

I like this in theory but it’s much harder to do in practice. First, each site is going to have different types of interactions so it’s never an out of the box type of solution. Second, sometimes having more interactions is a sign of bad user experience. Mind you, if interactions are up and so too is conversion then you’re probably okay.

Yet, not everyone has a clean conversion mechanism to validate interaction changes. So it comes down to interpretation. I personally love this part of the job since it’s about getting to know the user and defining a mental model. But very few organizations embrace data that can’t be validated with a p-score.

Those who are willing to optimize engagement will inherit the SERP.

There are just too many examples where engagement is clearly a factor in ranking. Whether it be a site ranking for a competitive query with just 14 words or a root term where low engagement has produced a SERP geared for a highly engaging modifier term instead.

Those bound by fears around ‘thin content’ as it relates to word count are missing out, particularly when it comes to Q&A.

TL;DR

Recent Google algorithm updates are changes to their understanding of language. Instead of focusing on E-A-T, which are not algorithmic factors, I urge you to look at the SERPs and analyze your traffic including the syntax of the queries.

Tracking Hidden Long-Tail Search Traffic

January 25 2018 // Analytics + SEO // 11 Comments

A lot of my work is on large consumer facing sites. As such, they get a tremendous amount of long-tail traffic. That’s right, long-tail search isn’t dead. But you might think so when you look at Google Search Console.

Hidden Search Traffic

I’ve found there’s more data in Google Search Console than you might believe. Here’s what I’m doing to track hidden long-tail search traffic.

Traffic Hazards

The first step in understanding how to track long-tail search is to make sure you’re not making mistakes in interpreting Google Search Console data.

Last year I wrote about the dangers of using the position metric. You can only use it reliably when looking at it on the query level and not the page level.

Today, I’m going the other direction. I’m looking at traffic by page but will be doing so to uncover a new type of metric – hidden traffic.

Page Level Traffic

The traffic for a single page in Google Search Console is comprehensive. That’s all the traffic to a specific page in that time frame.

Page Level Metrics from Google Search Console

But a funny thing happens when you look at the query level data below this page level data.

Query Level Data for a Page in Google Search Console

The numbers by query do not add up to the page level total. I know the first reaction many have is to curse Google and write off the data as being bad. But that would actually be a bad idea.

The difference between these two numbers are the queries that Google is suppressing because they are either too small and/or personally identifiable. The difference between the page total and visible total is your hidden long-tail traffic.

Calculating Hidden Traffic

Finding the amount of hidden long-tail traffic turns out to be relatively easy. First, download the query level data for that page. You’ll need to make sure that you don’t have more than 1,000 rows or else you won’t be able to properly count the visible portion of your traffic.

Once downloaded you calculate the visible total for those queries.

Visible Total for Page Level Queries

So you’ll have a sum of clicks, sum of impressions, a calculated clickthrough rate and then calculate a weighted average for position. The latter is what seems to trip a lot of folks up so here’s that calculation in detail.

=SUMPRODUCT(Ex:Ex,Cx:Cx)/SUM(Cx:Cx)

What this means is you’re getting the sum product of impressions and rank and then dividing that by the sum of impressions.

Next you manually put in the page total data we’ve been provided. Remember, we know this represents all of the data.

The clicks are easy. The impressions are rounded in the new Search Console. I don’t like that and I hope it changes. For now you could revert to the old version of search console if you’re only looking at data in the last 90 days.

(Important! The current last 7 days option in Search Console Beta is actually representative of only 6 days of data. WTF!)

From there I calculate and validate the CTR. Last is the average position.

To find the hidden long-tail traffic all you have to do is subtract the visible total from the page total. You only do that for clicks and impressions. Do not do that for CTR folks. You do the CTR calculation on the click and impression numbers.

Finally, you calculate the weighted position for the hidden traffic. The latter is just a bit of algebra at the end of the day. Here’s the equation.

=((C110*E110)-(C109*E109))/C111

What this is doing is taking the page total impressions * page total rank – visible page total impressions * visible page total rank and dividing that by the hidden page total impressions to arrive at the hidden page total rank.

The last thing I’ve done here is determine the percentage of clicks and impressions that are hidden for this page.

Hidden Traffic Total for Page Level Traffic

In this instance you can see that 26% of the traffic is hidden and … it doesn’t perform particularly well.

Using The Hidden Traffic Metric

This data alone is interesting and may lead you to investigate whether you can increase your long-tail traffic in raw numbers and as a percentage of total traffic. It can be good to know what pages are reliant on the more narrow visible queries and what pages draw from a larger number of hidden queries.

In fact, when we had full keyword visibility there was a very predictable metric around number of keywords per page that mapped to increases in authority. It still happens today, we just can’t easily see when it happens.

But one of the more interesting applications is in monitoring these percentages over time.

Comparing Visible and Hidden Traffic Over Time

What happens to these metrics when a page loses traffic. I took two time periods (of equal length) and then determined the percentage loss for visible, total and hidden.

In this instance the loss was almost exclusively in visible traffic. The aggregate position number (dangerous to rely on for specificity but good for finding the scent of a problem) leads me to believe it’s a ranking problem for visible keywords. So my job is to look at specific keywords to find which ones dropped in rank.

What really got me curious was when the opposite happens.

Hidden Traffic Loss

Here the page suffered a 29% traffic loss but nearly all of it was in hidden traffic. My job at that point is to figure out what type of long-tail queries suddenly evaporated. This isn’t particularly easy but there are clues in the visible traffic.

When I figured it out things got very interesting. I spent the better part of the last three months doing additional analysis along with a lot of technical reading.

I’ll cover the implications of changes to hidden traffic in my next post.

Caveats and Traps

Slow Your Roll

This type of analysis is not particularly easy and it does come with a fair number of caveats and traps. The first is the assumption that the page level data we get from Google Search Console is accurate and comprehensive. I’ve been told it is and it seems to line up to Google Analytics data. #ymmv

The second is that the data provided at the query level is consistent. In fact, we know it isn’t since Google made an update to the data collection and presentation in July of 2017.

Google Search Analytics Data Changes

Mind you, there were some other things that happened during that time and if you were doing this type of analysis then (which is when I started in earnest) you learned quite a bit.

You also must select a time period for that page that doesn’t have more than 1,000 visible queries. Without knowing the total visible query total you can’t calculate your hidden total. Finding the right timeframe can sometimes be difficult when looking at high volume pages.

One of the traps you might fall into is assuming that the queries in each bucket remain stable. That’s not always the case. Sometimes the composition of visible queries changes. And it’s hard to know whether hidden queries were promoted to visible or vice versa.

There are ways to control for some of this in terms of the total number of visible terms along with looking at not just the raw change in these cohorts but the percentage changes. But it can get messy sometimes.

In those situations it’s down to interpretation. Use that brain of yours to figure out what’s going on.

Next Steps and Requests

Shia Labeouf Just Do It

I’ve been playing with this metric for a while now but I have yet to automate the process. Adjacent to automation is the 1,000 visible query limit, which can be eliminated by using the API or tools like Supermetrics and/or Data Studio.

While performing this analysis on a larger set of pages would be interesting, I’ve found enough through this manual approach to keep me busy. I’m hopeful that someone will be excited to do the work to automate these calculations now that we have access to a larger data set in Google Search Console.

Of course, none of that would be necessary if Google simply provided this data. I’m not talking about the specific hidden queries. We know we’re never getting that.

Just give us a simple row at the end of the visible query rows that provides the hidden traffic aggregate metrics. An extra bonus would be to tell us the number of keywords that compose that hidden traffic.

After publishing this, John Mueller reminded me that this type of presentation is already integrated into Google Analytics if you have the Search Console integration.

The presentation does most of what is on my wishlist.

Other term in Google Analytics Search Console Integration

Pretty cool right? But it would be nice if (other) instead said (167 other search queries). The real problem with this is the data. It’s not comprehensive. Here’s the downloaded data for the page above including the (other) row.

GA Search Console Data Incomplete

It’s an interesting sub-set of the hidden queries but it’s incomplete. So fix the data discrepancy or port the presentation over into search console and we’re good. :-)

TL;DR

You can track hidden long-tail search traffic using Google Search Console data with some straight-forward math. Understanding and monitoring hidden traffic can help diagnose ranking issues and other algorithmic shifts.

What I Learned in 2017

January 18 2018 // Career + Life + SEO // 37 Comments

(This is a personal post so if that isn’t your thing then you should move on.)

2017 was a lot like 2016, but on steroids. That meant a 40% increase in the business, which unfortunately came with a lot more stress and angst. I did figure some things out and managed to make some decisions that I plan to put into practice in 2018.

Nothing Succeeds Like Success 

How Did I Get Here?

Last year I was finally comfortable calling Blind Five Year Old a success. I’d made it. But that came with a lot of strange baggage that I wasn’t entirely sure how to handle.

It was uncomfortable to write about how success can be difficult when you know that others are struggling. But I can only write about my own experience and acknowledge that some would take my words the wrong way.

Trust me, I understand that these are good problems. But they are problems nonetheless. In 2017 those problems grew. The very healthy income I had maintained for the past four years rose by 40%.

I stared at the run rate throughout the year kind of dumbfounded. For real? That much! It’s not that I lacked confidence and didn’t think I’d make it. The number was just beyond what I expected.

Money and Happiness

ABC 12 inch Art

Money is a strange beast. One of my favorite pieces last year was When life changing money, isn’t by Wil Reynolds. He captured a great deal of what I’ve struggled with over the past few years.

I’m at a place where bills aren’t a problem and I can essentially do what I want to do. My daughter needs a new tennis racquet, I buy one. Should we go out for dinner tonight? Why not. Want to vacation on the beach in Maui? Book it!

The ability to do these things makes me very different from a majority of people and that scares me.

The thing is, I don’t need a whole lot more. I’m not looking to get a better house or a better car. I don’t have a need to buy crazy expensive clothing. Hell, I spend most of my days in sweats behind this computer.

More money isn’t inherently bad. I mean, I do live in one of the most expensive areas in the country and I am all about putting more towards retirement and college. But both of those are now on track so the extra money doesn’t actually do that much more.

More money hasn’t made me happier.

Time and Stress

The additional work created a lot more pressure. There’s less time and more expectations. That combination doesn’t translate into more happiness. Not at all.
Not Enough Time In The Day

It might if I just wanted to coast on reputation and churn out whatever the minimum amount that was required to keep the money rolling in. But I’m not wired like that.

I’m not looking to mollify and appease, I’m looking to transform and build. Each client is different and requires research and due diligence to determine how to best tackle their search and business issues.

I feel the obligation of being a good partner and in delivering results. I don’t like cashing checks when a client’s business isn’t moving in the right direction.

Communication

Cool Hand Luke Failure To Communicate

I find it hard to respond quickly to something I believe requires greater thought. That means I’m slow and frequently don’t communicate well. I’ve come to the conclusion that this is a feature and not a bug.

Can I get better at telling people when I’m taking more time than they want? Yes. But I know it won’t go away completely. I’ll often slip into a cycle of not responding and then putting off responding until I have something more material and when I don’t the guilt increases and the response then must be that much better so I delay … again.

I do this less now than I used to. But I know it’ll still happen from time to time and I’m tired of feeling bad about that. Some clients just aren’t a match for my work style. And that’s okay.

Referrals and Relief

Bruce Sutter and Rollie Fingers Baseball Card

Much of what I describe above is why I continue to receive referrals. Good work gets noticed and in an industry rife with pretenders people happily promote those who truly get the work done.

I love referrals. But they also come loaded with additional stress. Because you don’t want to let the person referring you down. It’s not lost on me that they have enough confidence in me to trust them with one of their own connections.

What I’ve found in the last year is that more of these people understand the bind I’m in. I have only so much time and I’m not always the right person for a business. I specialize in large scale B2C sites like Pinterest and Genius. It’s not that I can’t do B2B. I just don’t enjoy it as much.

So they tell me up front that it might not be a match or they might even ask if further referrals are helping me or not. I tell you, it’s an incredible relief when referrals are put in this context.

I usually still take those calls though. I learned that just having a conversation with a referred lead is valuable. I don’t have to be the solution. I can help determine what they really need and can sometimes connect them with colleagues who I trust will do a good job on their behalf.

I become a link on a chain of expertise and trust. This is a highly valuable and scarce commodity.

Expert or Prima Donna

Separated M&Ms

The crux for me was in understanding my value. Not only understanding it but believing in it. Do I deserve that lawyer-like hourly rate? I don’t do a lot of hourly work now but I find it a good way to help more folks without the overhead of stress.

Lawyers have a defined set of expertise that many others don’t. Hopefully they also have a track record of success. So how does that compare to my business? The law is relatively stable and transparent. But search is the opposite. It changes and it is not transparent in the slightest.

Of course two lawyers can interpret the law differently, just as two SEOs can interpret search differently. But more so today than ever, the lack of information in our industry – or pure disinformation – puts a premium on connecting with true experts.

It’s not just finding someone who can help you figure out your search issues. It’s preventing them from following bad advice and throwing good money after bad.

My default is to say that I’m lucky to be in a position where I have more business than I can handle. But it’s not really luck. I put in the time and I get the results. I work hard and am constantly looking to keep my edge. What is it that I’m not seeing?

I use this as context to explain why I’m not willing to relinquish my work style. And I’m trying to recognize that it doesn’t make me a prima donna. It simply acknowledges that I’m an expert in my field and that I want to be happy.

It’s uncomfortable to charge a high rate and dictate specific terms of engagement. It’s like the Van Halen rider where they demanded M&Ms but no brown ones. I guess you can do worse than being the search equivalent of David Lee Roth. Particularly if you know the history around that famous rider.

Letting Angst Go

Let It Go

2017 was about embracing my value and believing in my expertise. It was about letting my own misgivings and angst go so that I can do the work I enjoy and be happy doing it.

Perhaps this sounds easy to some. But it hasn’t come easily for me. While I don’t gain validation from others, I don’t want to be one of those people who are out of touch and difficult to work with.

I absolutely dropped the ball on some leads and some clients in 2017. Never to the point where it hurt their business. But people were annoyed. I am truly sorry for that but … I no longer feel (overly) guilty about it.

I wanted to do the best work. I took on too much. I tried my best. I’ll wake up and try my best tomorrow.

I’ve learned to say no more often and not feel guilty about it or feel like it’s a missed opportunity. I’m not looking to build an agency and scale up. I’m a high-touch consultant with limited time constraints.

Raising Rates and Changing Retainers

Based on this I raised my rates. It’s the second time I’ve done that in the last three years. And I did it because one of my clients told me I should. It’s nice when clients are looking out for you as much as you are for them.

I also decided to remove the hourly maximum in my retainer agreements. In the past, I had a clause that essentially ensured that a client wouldn’t monopolize my time under a retainer agreement. I built in a hourly maximum just in case.

The problem was that by having that hourly maximum they were always thinking of the retainer in terms of the number of hours worked. That wasn’t what I was about. It isn’t about time. It’s about expertise and results.

This video on How To Price Design Services spoke to me so clearly.

I didn’t watch the entire video. I mean, who has 36 minutes! But that one segment was enough for me to know that it wasn’t the hours people should be paying for but the expertise.

This made a huge difference because I no longer have dreary conversations about whether I dedicated enough hours to support the retainer. I hate those conversations. They make me angry. So now I don’t have them.

Advisor Gigs

Opinions

I also sought out more advisor positions in 2017. I didn’t quite nail down how to best structure these engagements. And I did a lousy job of juggling those relationships versus my traditional relationships.

But that’s how you figure this stuff out. You stub your toe and move on trying not to make those same mistakes again. 2018 already looks good on this front with a number of interesting relationships where I can leverage my expertise in search and marketing.

I built most of my long term client relationships on trust and adding business value beyond traditional search. And while I may take advising positions based on my primary expertise I’m looking for those that value my larger knowledge set and insight from scores of clients over the past ten years.

I’ve learned quite a bit about what makes one start-up succeed where others fail.

Continuous Education

Change is always a constant in search. And I’d say that the rate of change is increasing. I’m lucky to work with some incredible technical teams. So when they say something I don’t quite understand I don’t just nod along.

I ask them to explain it. I tell people when I don’t know something. I’ll tell people I know enough to know something is off but not enough to tell them exactly what’s wrong. This is how you build expertise and gain trust.

And in 2018 I’ve asked a few developers I trust to take an afternoon to talk to me like a five year old about JavaScript frameworks and how they deliver content to the page. Now, I understand the topic. But I want to learn more.

One of my assets has been to have enough technical knowledge to know when someone is blowing smoke up my nether regions. A lot of what I ask people to do (instrumentation) is boring. As such, many developers inflate the complexity of those tasks. Asking a few pointed questions quickly reduces that inflation and gets the work done.

I don’t feel like I have that level of confidence on JavaScript frameworks. I can tell half of the developers I work with have a similar level of knowledge to my own. And when a developer admits as much we can easily collaborate, debate difficult questions and figure things out. But many developers aren’t going to admit to ‘good enough’ knowledge.

Learning more is always a priority.

Outsourcing

Ain't Nobody Got Time For That

On the other hand, I can’t do everything. I sometimes want to but there’s simply not enough time in the day. This blog needs a makeover and I’ll have to get someone else to do it. I have to let my tinkering ways go so I can grow and focus on other projects.

And there are other projects in the works. In the past I’ve had ideas, purchased domains and thought about building one thing or another. Great ideas! But they never went anywhere. A constant flow of renewing domain email notices remind me of the missed opportunities.

The biggest obstacle in those projects was … me. I wanted to do it all. I wanted to build the actual site, which might require learning a new programming and database language. And then I’d need to actually write all the content and then do all the marketing and promotion.

Ain’t nobody got time for that.

Well, maybe some people do but I’m not one of them. Even though I could, and part of me thinks it would be fun if I did, I shouldn’t spend my time that way. So I’m working with folks to spin up two sites and one potential tool.

Risk and Danger

Old School Risk Board and Pieces

I expect that it will be difficult for me to let go of some details. I’m guessing the projects will be messy, confusing, aggravating and hopefully rewarding in one way or the other. But honestly, there are specific lyrics from Contrails by Astronautalis that remain my guiding star.

The real risk is not a slipped grip at the edge of the peak
The real danger is just to linger at the base of the thing

Every time I take a risk I am happy I did so. I can’t tell you that it always worked out. But in some ways … it did, with enough time and perspective.

In each failure, I can pick out how that helped get me to where I am today. I’m not saying things couldn’t have been easier. They could have. I just decide to find the positive out of those situations.

That’s not some saccharine ‘everything happens for a reason’ tripe. Screw that. I can just tell a story where the ending is … happy. I have cancer but it’s one that’s easily treatable. That’s a win in my book.

Telling myself those stories and deciding that I’d rather dwell on what turned out right instead of wrong helps me take the next risk. It’s my job to listen to that restless itch and move my story forward knowing I may need to do some editing in post production.

Observations

Observation Deck Viewer

There were a lot of industry changes last year that had a meaningful impact on my business. I made a resolution to criticize less so I wavered in adding these observations because they’re not particularly rosy.

But the following things shaped my year from how I approach search analysis, to how I gain additional knowledge to how I educate clients.

The Google we knew is not the Google we’re dealing with today

I’ve been lucky to meet and talk with a number of Googlers throughout the years. They are overwhelmingly good people trying to do the right thing by users. The energy and passion they have around search is … inspiring.

But Matt Cutts left and Amit Singhal was replaced by John Giannandrea as the head of search. That doesn’t seem like a lot. But if you put your ear to the tracks and read the tea leaves you recognize that this was a massive change in direction for Google.

Machine learning is front and center and it’s an essential part of Google’s algorithm.

It’s not that good, passionate people aren’t still at Google. They are. But the environment is certainly different. We’re talking about people, experts in their field, given new direction from a new boss. How do you think you’d feel?

I believe understanding the people who work on search is an asset to understanding search. That’s more true today than ever.

Industry Content Is Lacking

I struggle to find good content to read these days. We lost our best investigative journalist last year along with another passionate and smart editor. Danny Sullivan and Matt McGee are sorely missed.

I used to take great pride in curating the industry and Tweeting out the best I could find each day. It was a steady stream of 2 or 3 Tweets a day. Now … it’s maybe twice a week. Maybe I’m just over-the-hill and not finding the new voices? Maybe I’m not dedicating enough time to combing Feedly?

But I’m discouraged when I open up a top trends of 2018 post (which I know is a mistake) and see ‘water is wet’ statements like ‘featured snippets will be important’ and ‘voice search is on the rise’.

Instead of bemoaning the bad, I would like to point out folks like Paul Shapiro for great technical content and Cyrus Shepard who seems to have taken up the mantle of curating our industry. There are other great specialists like Bill Slawski and Bartosz Goralweicz out there contributing but … there are too few of them for my taste.

And there are others who clearly have knowledge but aren’t sharing right now. I’m not going to call them out. Hell, I’d be calling myself out too. I think they’re all busy with work and life. Being industry famous doesn’t make their lives better. In fact, it causes more problems. I get it, but I wish we all had more time to move the conversation forward.

More data isn’t the problem, it’s the lack of interpretation and analysis. 

The conversations I see happening in the industry are often masturbatory and ego driven. Someone has to be right and someone has to be wrong. Real debate and true exploration seem like an endangered species.

For instance, knowing that Google is relying heavily on machine learning, shouldn’t the industry be looking at analyzing algorithmic changes in a different way.

Today, changes in rank are often tied to an update in the mapping of vectors to intent that renders a different mix of content on results. One can watch over many months as they test, learn and adapt on query classes in pursuit of optimal time to long click metrics.

I find the calcification of search truth to be dangerous given the velocity of changes inherent in our vertical. At the same time, the newest things don’t replace the tried and true. It’s these contradictions that make our industry interesting!

Beyond that, many are working off of a very limited data set. The fact that something worked for you on the one site that you tried it on might not mean much. Of course, we’ve also seen people with much larger data sets make mistakes in interpretation.

And that’s where things seem to have gone off the tracks. I don’t mind correlation studies. They provide another point of data for me to consider among a large number of other data points. I assign the findings from each correlation study a weight based on all of my other knowledge.

That means that some will receive very little weight and others more based on my understanding of how they were conducted and what I see in practice across my client base. We don’t need less data, less content or fewer tactics. We need to better understand the value of each and how they combine to help achieve search success.

As a result I see far more appetite for hiring growth engineers over SEOs largely because they’re willing to test and adapt instead of proselytize.

The Things That Matter

I’m cancer free! It’s been nearly three years now. And in 2017 I couldn’t use recovery as an excuse for my eating habits. So I lost 25 pounds.

For those interested, there’s no real magic to losing weight. Journal your food and take in fewer calories than you burn. It’s not always fun or easy but it works.

I gained 10 of that back in the last few months of the year. This was partly because I lost my tennis partners, which meant no calorie burning exercise cushion that allowed me a few days of indulgence each week.

Thankfully, my daughter is now finally getting back to tennis after physical therapy for a patellar subluxation, which is a dislocation of the kneecap. Her second in two years.

It turns out her thigh bone doesn’t have as deep a divot for her kneecap. It’s nearly flat, which means she’s prone to dislocations. The orthopedist mentioned that this also meant that when it did slip out it wouldn’t hurt nearly as much. Seems I’m not the only one who can tell a story that relies on the positive versus the negative. #callback

My wife, on the other hand, has tennis elbow, which is far more painful than she or I realized. She’ll be undergoing a procedure soon in hopes that it helps her tendon to bounce back and heal fully.

Things are actually quite good despite all this and the fact that my daughter is a teenager (yikes) and my wife just had sinus surgery. I’m around and I’m happier, which I hope is as infectious as this year’s flu.

Google Index Coverage Report

October 23 2017 // Analytics + SEO // 16 Comments

Google’s new Index Coverage report lets you “Fix problems that prevent your URLs from being optimally indexed by Google Search.”

As it stands the report delivers a huge increase in visibility, creates a host of new metrics to track and requires new sitemap configurations. But the real treasures are what you learn when you dig into the data.

Index Coverage Report

The Index Coverage report is a Google Search Console public beta that provides details on the indexation status for pages on a site or in a specific sitemap or sitemap index. It’s essentially a mashup of Index status and Sitemaps on steroids.

You’ll know if you have access if you have a ‘Try the new Search Console’ link at the top of the left hand navigation in Search Console.

A handful of my clients are part of this public beta. I wish more were. I asked for additional client access but was turned down. So if you don’t have this link, I can’t help you gain access to the beta.

Instead, I hope to provide a decent overview of the functionality that may or may not wind up being launched. And later on I’ll show that the data this report contains points to important optimization strategies.

Clicking on that ‘Try’ link sends you to the new look Search Console.

Index Coverage Report Entry Page

Clicking on the Index Coverage line gives you the full report. The top of the page provides a general trend in a stacked bar graph form for each status as defined by Google.

Index Coverage Full Report

The bottom of the page gives you the details within each status.

Index Coverage Full Report Bottom

Clicking on any of those rows provides you with a sample list of 1000 pages.

Index Coverage Sample Pages

You can download this data, which I did as you’ll see later. You can also filter these pages by ‘Page’ or ‘Last crawled’ date.

Index Coverage Download and Filter Options

This is particularly handy if you have named folders or even patterned syntax (e.g. – condos-for-rent vs houses-for-rent) that you filter on and determine the ratio of content within the sample provided.

You can choose to see this data for all known pages, all submitted pages or for an individual sitemap or sitemap index that is at the top level in your Google Search Console account.

Index Coverage Report by Sitemap

One thing to note here is that you must click the Excluded tab to add that to the report. And you’ll want to since there’s some interesting information in that status.

Indexation Status

The first thing to know here is that you get a lot of new terminology regarding the status of your URLs. Frankly, I think this is overkill for the vast majority of site owners. But I’m thrilled that the search community might get this level of detail.

Google classifies the status of a page into four major categories.

Index Coverage Status Definition Key

The Error and Warning areas are fairly straight forward so I’m not going to go into much detail there. Instead I want to cover the two major sub-status definitions for Valid pages.

Index Coverage Valid Definitions

Indexed, Low interest. Well hello there! What is this? It felt very much like a low or thin content signal. Visions of Pandas danced in my head.

I spent a lot of time looking at the sample pages in the Indexed, Low interest status. Sometimes the sample pages for this status made sense and other times they didn’t. I couldn’t quite figure out what made something low interest.

One client looked at the traffic to these two cohorts using the sample data across a number of sitemaps. The results for a seven day period were stunning.

The pages in Submitted and Indexed delivered 4.64 visits per page.

The pages in Indexed, Low interest delivered 0.04 visits per page.

Kirk Jazz Hands

It’s pretty clear that you want to avoid the Indexed, Low interest status. I imagine Google holding their nose while indexing it and keeping it around just in case they need to resort to it for some ultra long-tail query.

In contrast, the Submitted and Indexed status is the VIP of index status and content. If your content falls into this status it will translate into search success.

The other status that drew my attention was Excluded.

Index Coverage Report Excluded Sub Status Definitions

There are actually a lot more than pictured but the two most often returned are Crawled and Discovered – currently not indexed.

Reading the definitions of each it’s essentially Google giving the single bird and double bird to your content respectively. Crawled means they crawled it but didn’t index it with a small notation to ‘don’t call us, we’ll call you’.

Discovered – currently not indexed seems to indicate that they see it in your sitemap but based on how other content looks they’re not even going to bother crawling it. Essentially, “Ya ugly!” Or, maybe it’s just a representation of poor crawl efficiency.

Frankly, I’m not entirely sure that the definition of Discovered is accurate since many of the sample URLs under this status have a Last crawled date. That seems to contradict the definition provided.

And all of this is complicated by the latency in the data populating these reports. As of the writing of this post the data is 20 days behind. No matter the specific meaning, content with this status is bad news.

Indexation Metrics

New data leads to new calculated metrics. Sure you can track the trend of one status or another. But to me the real value is in using the data to paint a picture of health for each type of content.

Index Coverage Metrics

Here I have each page type as a separate sitemap index allowing me to compare them using these new metrics.

The ‘Valid Rate’ here is the percentage of pages that met that status. You can see the first has a massive Valid Rate while the others don’t. Not by a long shot.

But the metric I really like is the percentage Indexed and Submitted in relation to total Valid pages. In other words, of those pages that get the Valid status, how many of them are the ‘good’ kind.

Here again, the first page type not only gets indexed at a high rate but the pages that do get indexed are seen as valuable. But it’s the next two pages types that show why this type of analysis valuable.

Because both of the next two page types have the same Valid Rate. But one page type has a better chance of being seen as valuable than the next based on the percentage Indexed and Submitted.

I can then look at the percentage Discovered and see that there’s a large amount of pages that might be valid if they were crawled. With this in mind I’d work on getting the page type with a higher percentage I&S crawled more frequently since I have a 1 in 4 chance of those being ‘good’ pages.

Here’s an alternate way one client used to look at each sitemap and determine the overall value Google sees in each.

Index Coverage Metrics Matrix

It’s the same general principle but they’re using a ratio of Submitted and Indexed to Low interest to determine general health for that content.

It remains to be seen exactly what metrics will make the most sense. But the general guidance here is to measure the rate at which content is indexed at all and once indexed what percentage is seen as valuable.

Sitemap Configuration

I’ve long been a proponent of optimizing your sitemaps to gain more insight into indexation by page type. That usually meant having a sitemap index with a number of sitemaps underneath all grouped by page type.

The current Index Coverage report will force changes to this configuration if you want to gain the same level of insight. Instead of one sitemap index with groups of sitemaps representing different page types you’ll need a separate sitemap index for each page type. For smaller sites you can have a separate sitemap at the top level for each page type.

This is necessary since there is no drill down capability from a sitemap index to individual sitemap within the tool. And even if there were, it would be difficult to aggregate all of this data across multiple sitemaps.

Instead, you’ll use the sitemap index to do all of the aggregation for you. So you’d have a sitemap index for each page type and might even make them more granular if you thought there was a material difference on the same page type (e.g. – rap lyrics versus rock lyrics).

Don’t worry, you can have multiple sitemap index files in your account (at least up to 500 I believe) so you’ll have plenty of room for whatever scheme you can cook up.

Defining Low Interest

I got very interested in determining why a page would wind up in the low interest bucket. At first glance I figured it might just be about content. Essentially a Panda signal for thin or low value content.

But the more I dug the more I realized it couldn’t just be a content signal. I kept seeing pages that were very similar showing up in both Indexed, Low Interest and Submitted and Indexed. But I needed a more controlled set of content to do my analysis.

And then I found it.

Index Coverage Report Example

This sitemap contains state level pages for nursing homes. There are 54 in total because of Washington D.C., Guam, Puerto Rico and The Virgin Islands.

These pages are essentially navitorial pages meant to get users to the appropriate city of choice. What that means is that they are nearly identical.

Index Coverage Submitted and Indexed Example

Index Coverage Low Interest Example

Which one do you think is the low interest page? Because one of them is and … one of them is not. Do you think you could figure that out simply from the text on the page?

This defined set of content allowed me to easily compare each cohort to see if there were any material differences. I downloaded the pages for each cohort and used a combination of Google Keyword Planner, ahrefs and SEMrush to compile metrics around query volume, backlinks and keyword difficulty.

The query class I used to calculate these metrics is ‘nursing homes in [state].

Query Metrics

Query Metrics for Index Coverage Comparison

The volume is slightly higher for the Submitted and Indexed group but that’s skewed by Google grouping ‘va nursing homes’ into the Virginia query. This means folks potentially looking for veteran’s affairs nursing homes would fall into this query.

Low volume and high volume queries fall into both cohorts so I tend to think query volume isn’t a material difference. I added number of results to the mix after seeing the discrepancy between the two cohorts.

I found it a bit odd that there were fewer results for higher volume queries. I’m not sure what to make of this. Could there be a higher bar for content where there is a larger number of results? Further investigation is necessary but it didn’t jump to the top of my list.

Link Metrics

Index Coverage Comparison Link Metrics

The link metrics from ahrefs show no material difference. Not only that but when I look at the links they’re all rather similar in nature. So I find it hard to believe that one set had better topical links or more trusted links than another from a Google perspective.

Keyword Difficulty Metrics

Index Coverage Comparison Difficulty Metrics

Here again there wasn’t a material difference. Even more so if I account for the fact that Texas spiked higher at the time because of the flooding of nursing homes due to hurricane Harvey.

Now, I wouldn’t be taking you down this road if I didn’t find something that was materially different. Because I did.

Crawl Metrics

I’ve long been a proponent of crawl efficiency and crawl optimization. So it was interesting to see a material difference in the reported last crawl for each cohort.

Index Coverage Comparison Crawl Date Metrics

That’s a pretty stark difference. Could crawl date be a signal? Might the ranking team think so highly of the crawl team that pages that aren’t crawled as often are deemed less interesting? I’ve often thought something like this existed and have had offline talks with a number of folks who see similar patterns.

But that’s still just scuttlebutt really. So what did I do? I took one of the pages that was in the Low interest cohort and used Fetch as Google to request indexing of that page.

Sure enough when the data in the Index Coverage report was updated again that page moved from Low interest to Submitted and Indexed.

So, without any other changes Google was now reporting that a page that had previously been Low interest was now Submitted and Indexed (i.e. – super good page) based solely on getting it crawled again.

I'm Intrigued

Now, the data for the Index Coverage report has been so woefully behind that I don’t yet know if I can repeat this movement. Nor do I know how long that page will remain in Submitted and Indexed. I surmise that after a certain amount of time it will return back to the Low interest cohort.

Time will tell.

[Updated on 10/24/17]

The Index Coverage report data updated through October 6th. The update revealed that my test to get another page moved from Indexed, Low interest to Submitted and Indexed through a Fetch as Google request was successful. The prior page I moved also remains in Submitted and Indexed.

Strangely, a third page moved from Indexed, Low interest to Submitted and Indexed without any intervention. It’s interesting to see that this particular state was an outlier in that Low interest cohort in terms of engagement.

Good Engagement Moves Content

[Updated on 11/9/17]

On October 20, the first page I fetched moved back from Submitted and Indexed to Indexed, Low Interest. That means it took approximately 22 days for the ‘crawl boost’ (for lack of a better term) to wear off.

On October 31, the second page I fetched moved back from Submitted and Indexed to Indexed, Low Interest. That means it took approximately 26 days for the ‘crawl boost’ to wear off.

It’s hard to get an exact timeframe because of how infrequently the data is updated. And each time they update it’s a span of days that all take on the same data point. If that span is 7 days I have no clear idea of when that page truly moved down.

From the data, along with some history with crawl analysis, it seems like the ‘crawl boost’ lasts approximately three weeks.

It should be noted that both URLs did not seem to achieve higher rankings nor drive more traffic during that ‘crawl boost’ period. My assumption is that other factors prevented these pages from fully benefitting from the ‘crawl boost’.

Further tests would need to be done with content that didn’t have such a long and potentially negative history. In addition, testing with a page where you’ve made material changes to the content would provide further insight into whether the ‘crawl boost’ can be used to rehabilitate pages.

[Updated on 11/20/17]

The data is now current through November 11th and a new wrinkle has emerged. There are now 8 URLs in the Excluded status.

Index Coverage Trend November 11, 2017

One might think that they were all demoted from the Indexed, Low Interest section. That would make sense. But that’s not what happened.

Of the 6 URLs that are now in the Crawled status, three are from Indexed, Low Interest but three are from Submitted and Indexed. I’m not quite sure how you go from being super awesome to being kicked out of the index.

And that’s pretty much what Excluded means when you look at the information hover for that status.

Index Coverage Report Excluded Hover Description

The two other URLs that dropped now have the status Submitted URL not selected as canonical. Sure enough, it’s represented by one from Indexed, Low Interest and one from Submitted and Indexed.

There’s what I believe to be new functionality as I try to figure out what URL Google has selected as the canonical.

Index Coverage Page Details

None of it actually helps me determine which URL Google thinks is better than the one submitted. It’s interesting that they’ve chosen to use the info: command given that the functionality of this operator was recently reduced.

And that’s when I realize that they’ve changed the URLs for these pages from /local/nursing-homes-in-[state] to /local/states/nursing-homes-in-[state]. They did this with a 301 (yay!) but didn’t update the XML sitemap (boo!).

This vignette is a prime example of what it means to be an SEO.

It also means using these pages as a stable set of data has pretty much come to an end. However, I’ll poke the client to update the XML sitemaps and see what happens just to see if I can replicate the original breakdown between Submitted and Indexed and Indexed, Low Interest.

Internal Links

How did Google decide not to crawl the low interest cohort group as frequently? Because while the crawl might be some sort of recursive signal there are only a few ways it could arrive at that decision in the first place.

We know the content is the same, the links are the same and the general query volume and keyword difficulty are the same. Internal links could come into play but there are breadcrumbs back to the state page on every city and property page.

So logically I’d hazard that a state like California would have far more cities and properties, which would mean that the number of internal links would be higher for that state than for others. The problem? California is in the Low interest cohort. So unless having more links is worse I don’t think this is material.

But, when in doubt you keep digging.

The internal links report doesn’t show all of the state pages but what it does show is certainly interesting. Of the 22 state pages that do show up on this report only 2 of them fall into the Low interest cohort.

So that means 20 of the original 30 Submitted and Indexed (66%) had reported internal link density while only 2 of the original 24 Low interest (8%) had reported internal link density. That’s certainly a material difference!

By comparison a Screaming Frog crawl shows that the real internal link difference between these pages is different in the way I expected with larger states having more links than smaller ones.

Index Coverage Screaming Frog Internal Links

Those highlighted fall into the Low interest cohort. So there doesn’t seem to be a connection based on internal link density.

But let’s return to that Internal links report. It’s always been a frustrating, though valuable, report because you’re never quite sure what it’s counting and how often the data is updated. To date I only knew that making that report look right correlated highly with search success.

This new information gives rise to a couple of theories. Is the report based on the most recent crawl of links on a site? If so, the lower crawl rate for those in the Low interest cohort would produce the results seen.

Or could the links to those Low interest pages be deemed less valuable based on the evaluation of that page? We already know that Google can calculate the probability that a person will click on a link and potentially assign value based on that probability. So might the report be reflection of Google’s own value of the links they find?

Unfortunately there are few definitive answers though I tend to think the Internal links report oddity is likely driven by the crawl date discrepancy between the two cohorts.

Engagement Metrics

So I’m again left with the idea that Google has come to some conclusion about that cohort of pages that is then informing crawl and potentially internal link value.

Some quick regex and I have Google Analytics data for each cohort back to 2009. Yeah, I’ve got 8 years of data on these suckers.

Index Coverage Comparison Engagement Metrics

The engagement metrics on the Low interest cohort are materially worse than those on the Submitted and Indexed cohort.

Engagement, measured as some composite of adjusted click rate combined with a long click measurement, may be a factor in determining whether a page is of Low interest. It’s not the only factor but we’ve just ruled out a whole bunch of other factors.

“When you have eliminated the impossible, whatever remains, however improbable, must be the truth.”

Now, you might make the case that ranking lower might produce lower metrics. That’s possible but … I’m always wary when pretzel logic is introduced. Sure, sometimes our brain gets lazy and we make the easy (and wrong) connection but we also often work too hard to explain away the obvious.

Here’s what I do know. Pages in the Low interest cohort are clearly being demoted.

Query Based Demotion

The first Caring.com page returned for a search for ‘nursing homes in indiana’ is on page three and it isn’t the state page.

Query Example for Demoted Content

Google knows that this query is targeted toward the state of Indiana. There’s a local unit with Indiana listings and every other result on page one references the state of Indiana.

Now lets do the same search but with the site: operator.

Index Coverage Site Query Example

Suddenly Google has the state page as the first result. Of course the site: query isn’t a perfect tool to identify the most relevant content for a given query. But I tend to believe it provides a ballpark estimate.

If the site: operator removes other signals and simply returns the most relevant content on that site for a given term the difference between what is returned with and without is telling.

Any way you look at it, Google has gone out of their way to demote this page and others in the Low interest cohort for this query class. Yet for pages in the Submitted and Indexed cohort these state pages rank decently on page one (4th or 5th generally.)

Click Signals

Electric Third Rail Sign

The third rail of SEO these days is talking about click signals and their influence on rankings. I’ve written before about how the evidence seems to indicate Google does integrate this data into the algorithm.

There’s more I could add to that post and subsequent tests clients have done that I, unfortunately, can’t share. The analysis of these state pages provides further evidence that click data is employed. Even then, I acknowledge that it’s a small set of data and there could be other factors I’m missing.

But even if you don’t believe, behaving like you do will still help you succeed.

Other Index Coverage Findings

There are a number of other conclusions I’ve reached based on observing the data from multiple client reports.

Google will regularly choose a different canonical. Remember that rel=canonical is a suggestion and Google can and will decide to ignore it when they see fit. Stop canonical abuse and use 301 redirects (a directive) whenever possible.

Google sucks at dealing with parameters. I’ve said it over and over. Parameter’s are the devil. Googlebot will gorge themselves on parameter based URLs to the detriment of the rest of your corpus.

Google will ignore href lang targeted for that country or language. The markup itself is brittle and many have struggled with the issue of international mismatches. You can actively see them doing this by analyzing the Index Coverage report data.

One of the more frustrating situations is when the local version of your home page isn’t selected for that localized search. For instance, you might find that your .com home page is displayed instead of your .br home page in Brazil.

If you believe that engagement is a signal this actually might make sense. Because many home pages either give users and easy way to switch to a local domain or may automatically redirect users based on geo-IP or browser language. If this is the case, clicks on a mismatch domain would still provide positive engagement signals.

Those clicks would still be long clicks!

The feedback loop to Google would be telling them that the .com home page was doing just swell in Brazil. So there’s no reason for Google to trust your href lang markup and make the switch.

I’m not 100% convinced this is what is happening but … it’s a compelling argument.

Get Ready

There are a few things you can do to get ready for the full rollout of the Index Coverage report. The first is to reorganize your sitemap strategy so you have your sitemaps or sitemap index files all at the top level broken down by page type or whatever other strategy that delivers value.

The second is to begin or refine tracking of engagement metrics such as modified bounce rate and specific event actions that may indicate satisfaction. I’m still working to determine what baseline metrics make sense. Either way, SEO and UX should be working together and not against each other.

TL;DR

The new Index Coverage report provides a new level of insight into indexation issues. Changes to your sitemap strategy will be required to take full advantage of the new data and new metrics will be needed to better understand how your content is viewed by Google.

Data from the Index Coverage report confirms the high value of crawl efficiency and crawl optimization. Additional analysis also provides further evidence that click signals and engagement are important in the evaluation and ranking of content.

Analyzing Position in Google Search Console

July 18 2017 // Analytics + SEO // 20 Comments

Clients and even conference presenters are using Google Search Console’s position wrong. It’s an easy mistake to make. Here’s why you should only trust position when looking at query data and not page or site data.

Position

Google has a lot of information on how they calculate position and what it means. The content here is pretty dense and none of it really tells you how to read and when to rely on the position data. And that’s where most are making mistakes.

Right now many look at the position as a simple binary metric. The graph shows it going down, that’s bad. The graph shows it going up, that’s good. The brain is wired to find these shortcuts and accept them.

Search Analytics Site Level Trend Lies

As I write this there is a thread about there being a bug in the position metric. There could be. Maybe new voice search data was accidentally exposed? Or it might be that people aren’t drilling down to the query level to get the full story.

Too often, the data isn’t wrong. The error is in how people read and interpret the data.

The Position Problem

The best way to explain this is to actually show it in action.

Search Analytics Position Example

A week ago a client got very concerned about how a particular page was performing. The email I received asked me to theorize why the rank for the page dropped so much without them doing anything. “Is it an algorithm change?” No.

Search Analytics Position Comparison Day over Day

If you compare the metrics day over day it does look pretty dismal. But looks can be deceiving.

At the page level you see data for all of the queries that generated an impression for the page in question. A funny thing happens when you select Queries and look at the actual data.

Search Analytics Position Term Expansion

Suddenly you see that on July 7th the page received impressions for queries that were not well ranked.

It doesn’t take a lot of these impressions to skew your average position.

A look at the top terms for that page shows some movement but nothing so dramatic that you’d panic.

Top Terms for a Page in Search Analytics

Which brings us to the next flaw in looking at this data. One day is not like the other.

July 6th is a Thursday and July 7th is a Friday. Now, usually the difference between weekdays isn’t as wide as it is between a weekday and a weekend but it’s always smart to look at the data from the same day in the prior week.

Search Analytics Position Week over Week

Sure enough it looks like this page received a similar expansion of low ranked queries the prior Friday.

There’s a final factor that influences this analysis. Seasonality. The time in question is right around July 4th. So query volume and behavior are going to be different.

Unfortunately, we don’t have last year’s data in Search Analytics. These days I spend most of my time doing year over year analysis. It makes analyzing seasonality so much easier. Getting this into Search Analytics would be extremely useful.

Analyzing Algorithm Changes

User Error

The biggest danger comes when there is an algorithm change and you’re analyzing position with a bastardized version of regex. Looking at the average position for a set of pages (i.e. – a folder) before and after an algorithm change can be tricky.

The average position could go down because those pages are now being served to more queries. And in those additional queries those pages don’t rank as high. This is actually quite normal. So if you don’t go down to the query level data you might make some poor decisions.

One easy way to avoid making this mistake is to think hard when you see impressions going up but position going down.

When this type of query expansion happens the total traffic to those pages is usually going up so the poor decision won’t be catastrophic. It’s not like you’d decide to sunset that page type.

Instead, two things happen. First, people lose confidence in the data. “The position went down but traffic is up! The data they give just sucks. You can’t trust it. Screw you Google!”

Second, you miss opportunities for additional traffic. You might have suddenly broken through at the bottom of page one for a head term. If you miss that you lose the opportunity to tweak the page for that term.

Or you might have appeared for a new query class. And once you do, you can often claim the featured snippet with a few formatting changes. Been there, done that.

Using the average position metric for a page or group of pages will lead to sub-optimal decisions. Don’t do it.

Number of Queries Per Page

Princess Unikitty Boardroom

This is all related to an old metric I used to love and track religiously.

Back in the stone ages of the Internet before not provided one of my favorite metrics was the number of keywords driving traffic to a page. I could see when a page gained enough authority that it started to appear and draw traffic from other queries. Along with this metric I looked at traffic received per keyword.

These numbers were all related but would ebb and flow togther as you gained more exposure.

Right now Google doesn’t return all the queries. Long-tail queries are suppressed because they’re personally identifiable. I would love to see them add something that gave us a roll-up of the queries they aren’t showing.

124 queries, 3,456 impressions, 7.3% CTR, 3.4 position

I’d actually like a roll-up of all the queries that are reported along with the combined total too. That way I could track the trend of visible queries, “invisible” queries and the total for that page or site.

The reason the number of queries matters is that as that page hits on new queries you rarely start at the top of those SERPs. So when Google starts testing that page on an expanded number of SERPs you’ll find that position will go down.

This doesn’t mean that the position of the terms you were ranking for goes down. It just means that the new terms you rank for were lower. So when you add them in, the average position declines.

Adding the roll-up data might give people a visual signpost that would prevent them from making the position mistake.

TL;DR

Google Search Console position data is only stable when looking at a single query. The position data for a site or page will be accurate but is aggregated by all queries.

In general, be on the look out for query expansion where a site or page receives additional impressions on new terms where they don’t rank well. When the red line goes up and the green goes down that could be a good thing.

Ignoring Link Spam Isn’t Working

July 06 2017 // SEO // 39 Comments

Link spam is on the rise again. Why? Because it’s working. The reason it’s working is that demand is up based on Google’s change from penalization to neutralization.

Google might be pretty good at ignoring links. But pretty good isn’t good enough.

Neutralize vs Penalize

For a very long time Google didn’t penalize paid or manipulative links but instead neutralized them, which is a fancy way of saying they ignored those links. But then there was a crisis in search quality and Google switched to penalizing sites for thin content (Panda) and over optimized links (Penguin).

The SEO industry underwent a huge transformation as a result.

Google Trends for Content Marketing

I saw this as a positive change despite having a few clients get hit and seeing the industry throw the baby (technical SEO) out with the bathwater. The playing field evened and those who weren’t allergic to work had a much better chance of success.

Virtually Spotless

Cascade Print Ad

This Cascade campaign and claim is one of my favorites as a marketer. Because ‘virtually spotless’ means those glasses … have spots. They might have less spots than the competition but make no mistake, they still have spots.

This was Gary’s response to a Tweet about folks peddling links from sites like Forbes and Entrepreneur. I like Gary. He’s also correct. Unfortunately, none of that matters.

Pretty good is the same as virtually spotless.

Unless neutralization is wildly effective in the first month those links are found then it will ultimately lead to more successful link spam. And that’s what I’m seeing. Over the last year link spam is working far more often, in more verticals and for more valuable keywords.

So when Google says they’re pretty good at ignoring link spam that means some of the link spam is working. They’re not catching 100%. Not by a long shot.

Perspective

Lighting a Cigar with a 100 Dollar Bill

One of the issues is that, from a Google perspective, the difference might seem small. But to sites and to search marketing professionals, the differences are material.

I had a similar debate after Matt Cutts said there wasn’t much of a difference between having your blog in a subdomain versus having it in a subfolder. The key to that statement was ‘much of’, which meant there was a difference.

It seemed small to Matt and Google but if you’re fighting for search traffic, it might turn out to be material. Even if it is small, do you want to leave that gain on the table? SEO success comes through a thousand optimizations.

Cost vs Benefit

Perhaps Google neutralizes 80% of the link spam. That means that 20% of the link spam works. Sure, the overall cost for doing it goes up but here’s the problem. It doesn’t cost that much.

Link spam can be done at scale and be done without a huge investment. It’s certainly less costly than the alternative. So the idea that neutralizing a majority of it will help end the practice is specious. Enough of it works and when it works it provides a huge return.

It’s sort of like a demented version of index investing. The low fee structure and broad diversification mean you can win even if many of the stocks in that index aren’t performing.

Risk vs Reward

Get Out Jail Free Monopoly Card

Panda and Penguin suddenly made thin content and link spam risky. Sure it didn’t cost a lot to produce. But if you got caught, it could essentially put your site six feet under.

Suddenly, the reward for these practices had to be a lot higher to offset that risk.

The SEO industry moaned and bellyached. It’s their default reaction. But penalization worked. Content got better and link spam was severely marginalized. Those who sold the links were now offering link removal services. Because the folks who might buy links … weren’t in the market anymore.

The risk of penalty took demand out of the market.

Link Spam

I’m sure many of you are seeing more and more emails peddling links showing up in your inbox.

Paid Link Outreach Email

Some of them are laughable. Yet, that’s what makes it all the more sad. It shows just how low the bar is right now for making link spam work.

There are also more sophisticated link spam efforts, including syndication spam. Here, you produce content once with rich anchor text (often on your own site) and then syndicate that content to other platforms that will provide clean followed links. I’ve seen both public and private syndication networks deliver results.

I won’t offer a blow-by-blow of this or other link manipulation techniques. There are better places for that and others who are far more versed in the details.

However, a recent thread in the Google Webmaster Help forum around a PBN is instructive.

Black Hat Private Blog Networks Thread

The response by John Mueller (another guy I like and respect) is par for the course.

The tricky part about issues like these is that our algorithms (and the manual webspam team) often take very specific action on links like these; just because the sites are still indexed doesn’t mean that they’re profiting from those links.

In short, John’s saying that they catch a lot of this and ignore those links. In extreme cases they will penalize but the current trend seems to rely on neutralization.

The problem? Many of us are seeing these tactics achieve results. Maybe Google does catch the majority of this spam. But enough sneaks through that it’s working.

Now, I’m sure many will argue that there are other reasons a site might have ranked for a specific term. Know what? They might be right. But think about it for a moment. If you were able to rank well for a term, why would you employ this type of link spam tactic?

Even if you rationalize that a site is simply using everything at their disposal to rank, you’d then have to accept that fear of penalty was no longer driving sites out of the link manipulation market.

Furthermore, by letting link manipulation survive ‘visually’ it becomes very easy for other site owners to come to the conclusion (erroneous or not) that these tactics do work. The old ‘perception is reality’ adage takes over and demand rises.

So while Google snickers thinking spammers are wasting money on these links it’s the spammers who are laughing all the way to the bank. Low overhead costs make even inefficient link manipulation profitable in a high demand market.

I’ve advised clients that I see this problem getting worse in the next 12-18 months until it reaches a critical mass that will force Google to revert back to some sort of penalization.

TL;DR

Link spam is falling through the cracks and working more often as Google’s shift to ignoring link spam versus penalizing it creates a “sellers market” that fuels link spam growth.

What I Learned in 2016

January 02 2017 // Career + Life // 14 Comments

(This is a personal post so if that isn’t your thing then you should move on.) 

2016 was the year where things went back to normal. My cancer was in remission, family life was great and business was booming. But that ‘normal’ created issues that are rarely discussed. Managing success is harder than I expected.

Success

Success Graph

I made it. Blind Five Year Old is a success. Even through my chemotherapy, I kept the business going without any dip in revenue. Looking at the numbers, I’ve had the same revenue four years in a row. That’s a good thing. It’s a revenue figure that makes life pretty darn comfortable.

It wasn’t always like this. Back in 2010 I was always waiting for the other shoe to drop. Even as I put together back-to-back years of great business revenue I still had that paranoia. What if things dried up? But in 2016, cancer in the rear view, I felt bulletproof. The result? I was restless and, at times, unmotivated.

Guilt

Image of Guilt

You don’t hear a lot about this topic because you feel guilty talking about it. You’ve got to figure you’re going to come off like a douchebag complaining about success when so many others are struggling.

I’ve been dealing with that not just in writing about it but in living it too. While I’ve never been poor, I’ve often lived paycheck to paycheck. At one point I was out of work and $25,000 in debt.

My wife and I lived in an apartment for 10 years, saving like crazy so we could buy a house in the Bay Area. And once bought, we were anxious about making it all work. I had nightmares about being foreclosed on.

But we made it. I worked hard to build my business and we made smart moves financially, refinancing our mortgage twice until we had an amazing rate and very manageable mortgage payment. My wife was the backbone of the household, keeping everything going and making it easy for me to concentrate on the business.

For a long time it was all about getting there – about the struggle. Even as the business soared we then had to tackle cancer. Now, well now things are … easy.

Easy Street

Is Success a Dead End?

It’s strange to think how easy it is to just … buy what you want. Now, I’m not saying I can run out and buy my own private island. I’m not super-rich. But I’m not concerned about paying the bills. I’m not thinking whether I can afford to give my daughter tennis lessons or get my wife a leather jacket or buy a new phone. I just do those things.

And that feels strange … and wrong in some ways. Because I know that life isn’t like this for the vast majority.

Of course, I can rationalize some of this by pointing to my work ethic, attention to detail and willingness to take risks. No doubt I benefited from some friendships. I didn’t get here alone. But that too was something I cultivated. I try not to be a dick and generally try to be helpful.

But it’s still unsettling to be so comfortable. Not just because I keenly feel my privilege but also because it saps ambition.

Is That All?

Is That All?

When you’re comfortable, and feeling guilty about that, you often start to look for the next mountain to climb. I think that’s human nature. If you’ve made it then you look around and ask, is that all? Am I just going to keep doing this for the next twenty years?

For me, this presents a bit of a problem. I’m not keen on building an agency. I know a bunch of folks who are doing this but I don’t think it’s for me. I don’t enjoy managing people and I’m too much of a perfectionist to be as hands off as I’d need to be.

I took a few advisor positions (one of which had a positive exit last year) and will continue to seek those out. Perhaps that’s the ‘next thing’ for me, but I’m not so sure. Even if it is, it seems like an extension of what I’m doing now anyway.

Enjoy The Groove

Curry in the Groove

In the last few months I’ve come to terms with where I am. There doesn’t necessarily need to be a ‘second act’. I like what I do and I like the life I’ve carved out for myself and my family. If this is it … that’s amazing.

I remember keenly the ‘where do you see yourself in five years’ question I’d get when interviewing. Working in the start-up community, I never understood why people asked that question. Things change so fast. Two years at a job here is a long time. Opportunities abound. Calamity can upset the applecart. Any answer you give is wrong.

I’m not saying I’m letting the random nature of life direct me. What I’m saying is more like an analogy from basketball. I’m no longer going to force my shot. I’m going to let the game come to me. But when it does I’ll be ready to sink that three.

Staying Motivated

So how do you stay ready? That to me is the real issue when you reach a certain level of success. How do you keep going? How do you stay motivated so you’re ready when the next opportunity comes up?

There’s a real practical reason to keep things going right? The money is good. I’m putting money away towards my daughter’s college education and retirement. Every year when I can put chunks of money away like that I’m winning.

But when you’re comfortable and you feel like you’re on top of the world it’s hard to get motivated by money. At least that’s how it is for me. To be honest, I haven’t figured this one out completely. But here’s what I know has been helping.

Believe In Your Value

Believe In Your Value

Over the last few years there’s been a surge in folks talking about imposter syndrome. While I certainly don’t think I’m a fraud, there’s an important aspect in imposter syndrome revolving around value.

I’m not a huge self-promoter. Don’t get my wrong, I’ll often humble brag in person or via IM and am enormously proud of my clients and the success I’ve had over the last decade. But I don’t Tweet the nice things others say about me or post something on Facebook about the interactions I have with ‘fans’. I even have issues promoting speaking gigs at conferences and interviews. I’m sure it drives people crazy.

What I realized is that I was internalizing this distaste for self-promotion and that was toxic.

That doesn’t mean you’ll see me patting myself on the back via social media in 2017. What it means is that I’m no longer doubting the value of my time and expertise. Sounds egotistical. Maybe it is. But maybe that’s what it takes.

Give Me A Break

Kit Kat Wrapper

Going hand in hand with believing in your own value is giving yourself a break. I often beat myself up when I don’t return email quickly. Even as the volume of email increased, and it still does, I felt like a failure when I let emails go unanswered. The longer they went unanswered, the more epic the reply I thought I’d need to send, which meant I didn’t respond … again. #viciouscycle

A year or so ago I mentioned in an email to Jen Lopez how in awe I was at the timely responses I’d get from Rand. She sort of chided me and stated that this was Rand’s primary job but not mine. It was like comparing apples and oranges. The exchange stuck with me. I’m not Superman. Hell, I’m not even Batman.

I do the very best I can but that doesn’t mean that I don’t make mistakes or drop the ball. And that’s okay. Wake up the next day and do the very best you can again. Seems like that’s worked out well so far.

Rev The Engine

Liquid Draino

All of my work is online. That’s just the nature of my business. But I find that taking care of some offline tasks can help to rev the engine and get me going online. Folding my laundry is like Liquid Draino to work procrastination.

I don’t know if it’s just getting away from the computer or the ability to finish a task and feel good about it that makes it so effective. I just know it works.

In 2017 I’ve also committed to getting back into shape. I’ve been inspired by my friend Chris Eppstein who transformed his body and outlook in 2016. It’s important to keep moving so I’ll be on my elliptical and out on the tennis court a lot more often this year.

Gratitude

I’m grateful for where I am in my life. I know I didn’t get here alone. My wife is simply … amazing. And I’m consistently stunned at what my daughter says and does as she grows up. And it’s great to have my parents nearby.

There have also been numerous people throughout my life who have helped me in so many ways. There was Terry ‘Moonman’ Moon who I played video games with at the local pizza place growing up. “You’re not going down the same road,” he told me referring to drugs. There was Jordan Prusack, who shielded me from a bunch of high school clique crap by simply saying I was cool. (He probably doesn’t even remember it.)

In business, I’ve had so many people who have gone out of their way to help me. Someone always seemed there with a lifeline. Just the other day I connected with someone and we had a mutual friend in common – Tristan Money – the guy who gave me my second chance in the dot com industry. I remember him opening a beer bottle with a very large knife too.

Kindness comes in many sizes. Sometimes it’s something big and sometimes it’s just an offhand comment that makes the difference. My life is littered with the kindness of others. I like to remember that so that I make it habit to do the same. And that’s as good a place to stop as any.

xxx-bondage.com